Microphones: Polar Response 2
In the nineteenth instalment of this on-going series Greg Simmons runs a marathon with the Distance Factor. There’s not a lot to say about it… or is there?
In the previous instalment we defined ‘on-axis sound’ as being any sound that arrives directly on-axis to the microphone – a definition that, by default, means any sound that does not arrive on-axis is therefore ‘off-axis sound’. On-axis sound is almost certainly coming from whatever we’ve pointed the microphone at, so we can consider that to be desirable. What about off-axis sound? Is it good or bad?
In the close-miked world of popular music, whether in the studio or on stage, off-axis sound is generally considered bad – it’s usually coming from a different sound source that we don’t want to capture with the microphone we’re placing, and is especially bad if it is so far off-axis that it sounds dull and muddy. The whole point of close-miking is to focus on the required sound and capture it with as much isolation (i.e. lack of other sounds) as possible.
In the distant-miked worlds of nature recording and capturing atmos for film, the opposite is true: the majority of sound sources are off-axis, they might all be required, and the goal is to capture them all equally well.
The two-mic direct-to-stereo world of choral, chamber and similar acoustic music sits somewhere in between: not all of the musical sound sources are on-axis, and a large proportion of the off-axis sound (i.e. the reverberation of the performance space) must be captured at an appropriate balance with the direct sound of the music.
In distant-miking applications such as nature recording, atmos for film, and direct-to-stereo recording, the tonality of the off-axis sounds is vitally important.
Distance & Tonality
Moving further from the sound source places additional demands on our mics that we rarely have to consider when close-miking. When we move a directional mic beyond approximately 30cm from the sound source we lose low frequency energy due to the proximity effect, as discussed in previous instalments of this series. Moving beyond approximately 60cm from the sound source creates challenges with our choices of polar response and mic placement, and moving even further exposes weaknesses that explain the hitherto inexplicable price difference between a small single-diaphragm cardioid condenser that costs $200 and one that costs $2000 when both appear to have the same basic specifications.
To understand these things we need to explore two important aspects of a microphone’s polar response. The first is its Distance Factor, which is an important part of microphone choice and placement. The second is a microphone’s Off-Axis Response, which is often what we’re paying for when we choose the $2000 mic over the $200 mic. To understand the relevance of Distance Factor and Off-Axis Response, we’ll also need to take a brief look at room acoustics. In this instalment we’re going to focus on room acoustics and Distance Factor. In the next instalment we’ll look at Off-Axis Response…
DISTANCE FACTOR
The Distance Factor is simply a number for comparing the directionality of different polar responses. A polar response with a high Distance Factor can be placed further from the sound source than a polar response with a low Distance Factor while still capturing the same balance of direct sound and indirect sound.
Let’s consider the direct sound to be the sound we want to capture on-axis from the sound source, and the indirect sound to be the reverberation of the room. Let’s also consider the reverberation of the room to be a true diffuse field – which ultimately means off-axis sound can arrive from any direction with equal probability, and the SPL is consistent throughout the room. These are the conditions in which the Distance Factor figure is accurate: it is, essentially, a mathematical indication of the level of the direct sound (on-axis) versus the level of sounds arriving from all other directions (off-axis) in a diffuse field. That seems simple to understand, and probably explains why most audio textbooks devote very few words to Distance Factor. But if we look further, so to speak, we’ll see that Distance Factor is worthy of its own instalment in this series because it ties together polar response, microphone placement and room acoustics. There’s not a lot to say about the Distance Factor, but there’s a lot to say around it. Let’s get started…
Direct Sound vs Reverberation
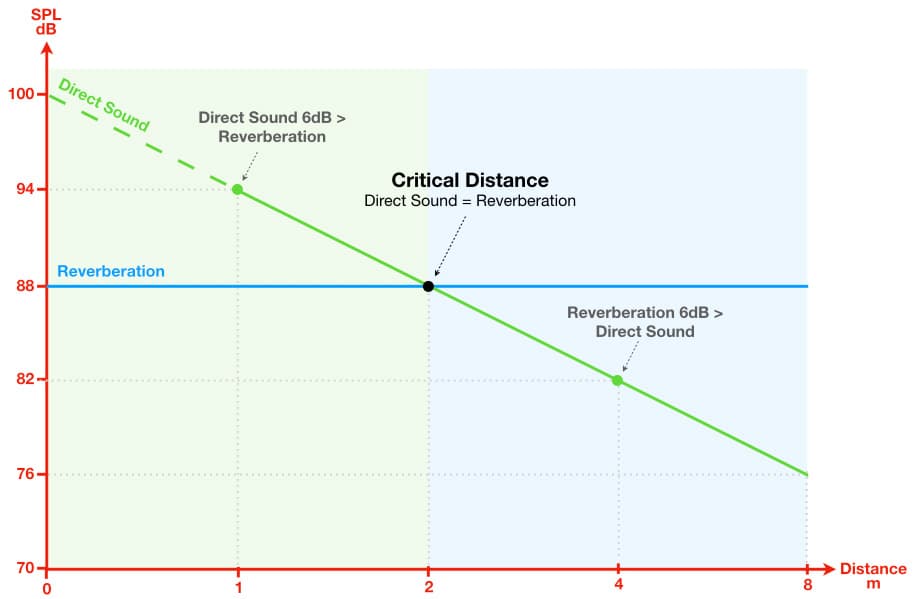
The relationship between the direct sound, the room’s reverberation and the distance from the sound source is shown in the graph below, with SPL on the vertical axis and distance on the horizontal axis. Note that on this graph the distance doubles with each equal-sized increment of the horizontal axis moving to the right, just as the SPL doubles (i.e. +6dB = 2x) with each equal-sized increment of the vertical axis moving upwards.
Moving further from the sound source places additional demands on our mics that we rarely have to consider when close-miking.
The diagonal green line represents the SPL of the direct sound, on-axis from the sound source and on-axis to the microphone. In this particular example the graph shows that the direct sound’s SPL was 94dB at a distance of 1m in front of the sound source. From there we can see that the direct sound’s SPL decreases by 6dB (i.e. halves) with every doubling of distance, in accordance with the Inverse Square Law. So every increment in distance along the horizontal axis doubles the distance from the sound source and halves the direct sound’s SPL.
The horizontal blue line represents the SPL of the reverberation, which, as we’ve already stated, is a diffuse field creating an SPL that is consistent throughout the room regardless of the distance from the source. In this particular example it is 88dB SPL. Every increment along the horizontal axis doubles the distance from the sound source but has no effect on the reverberation’s SPL.
At 1m from the sound source we can see that the direct sound’s SPL of 94dB is 6dB higher than the reverberation’s SPL of 88dB. As we move further from the sound source we eventually reach a distance where the direct sound has the same 88dB SPL as the reverberation. This is known as the Critical Distance, and in this example it is 2m. At distances less than the Critical Distance the direct sound is dominant, while at distances greater than the Critical Distance the reverberation is dominant. Close mics are placed within the Critical Distance because they’re intended to capture more of the direct sound and less reverberation, while room mics are located beyond the Critical Distance because they’re intended to capture more reverberation and less direct sound. The fundamental goal of two-mic direct-to-stereo recording is to place the microphones at a distance that captures an appropriate balance of direct and reverberant sound, while also capturing a mix of the direct sounds that represents and serves the music.
All of this sheds light on something we intuitively know: as we move the mic further from the sound source we get more reverberation (aka room sound). What really happens, as confirmed by the previous graph, is that as we move further from the sound source the reverberation stays the same but the direct sound decreases. The end result is perceptually the same: with more distance the room sound becomes more apparent. When we move the mic(s) further from the sound source we increase the gain to bring the direct sound back up to the desired level, and the increase in gain brings the reverberation up with it unless we change to a polar response with a higher Distance Factor.
Comparing Distance Factors
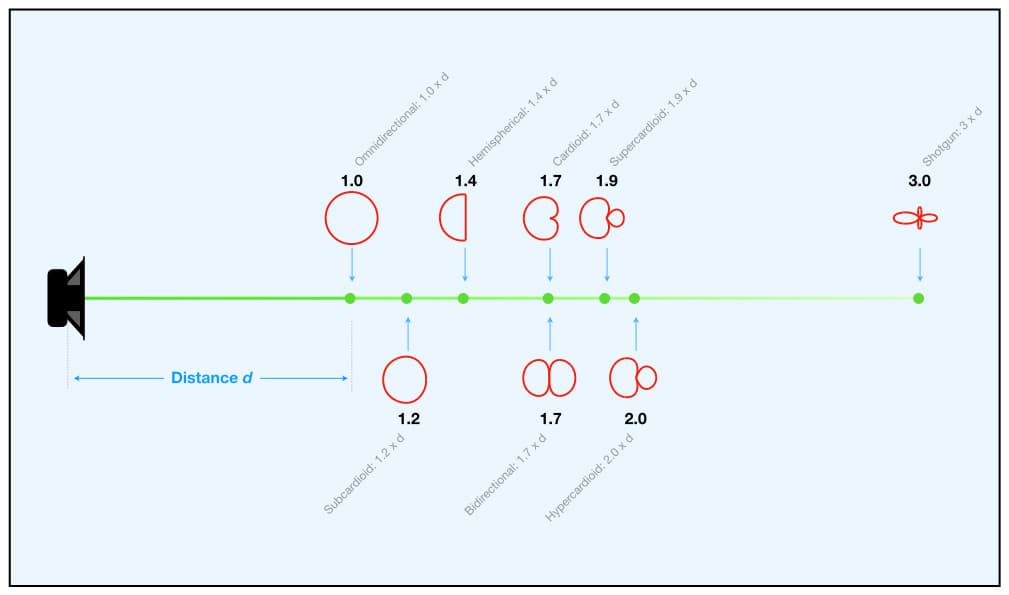
The illustration below provides a visual explanation of the Distance Factor values. On the left there is a single sound source (a speaker) placed in a large space. The reverberation of the space, which is evenly distributed throughout the room, is represented by the opaque blue background. Extending out from the speaker is a horizontal green line indicating the direct sound, on-axis from the speaker. A series of dots appear along the green line, each representing the distance and location that a particular polar response must be placed – relative to the omnidirectional polar response – to ensure that each polar response captures the same balance of direct and reverberant sound.
...and the increase in gain brings the reverberation up with it unless we change to a polar response with a higher Distance Factor.
The first dot from the left represents the location of the omnidirectional polar response, which is the reference for all of the Distance Factors. It has been placed at a certain distance from the sound source (i.e. the speaker); it could be any distance we chose that provided the desired balance of direct sound and reverberation. For this example let’s use the Critical Distance, where the balance of direct sound and reverberant sound is the same.
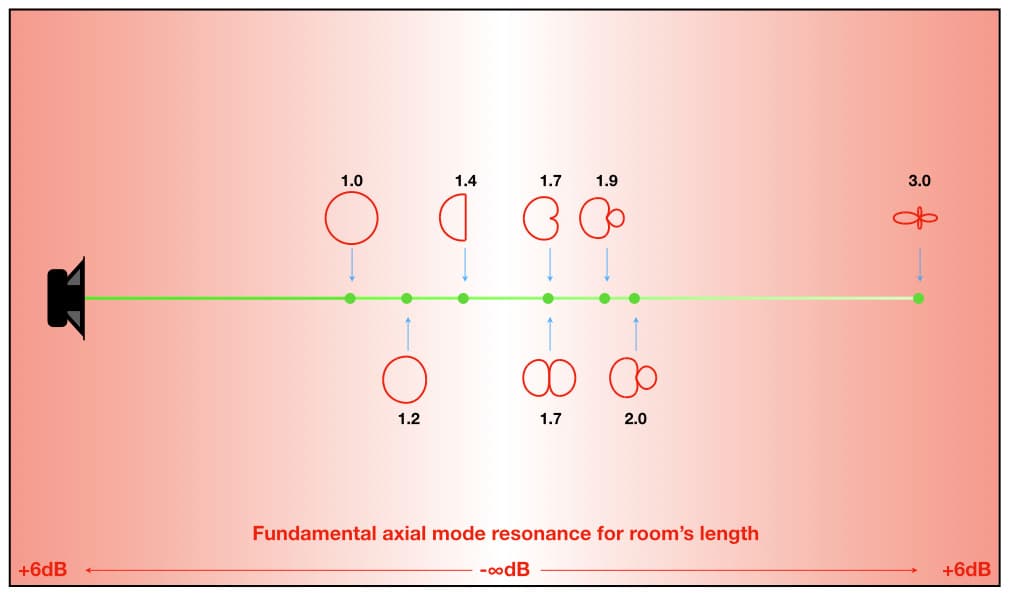
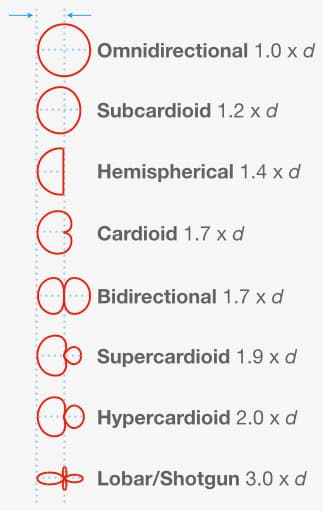
It doesn’t matter what units of measurement we use to represent the distance between the sound source and the omnidirectional microphone; all that matters is that it is the distance required to place an omnidirectional microphone in front of that sound source in that room to capture our desired balance of direct sound and reverberant sound. We’ll call it a ‘unit of distance’, abbreviated to d. This gives the omnidirectional polar response a Distance Factor of 1.0, because its distance is 1.0 x d from the sound source.
[Note that, unlike the previous illustration, the horizontal axis in this graph is measured in linear multiples of distance. If you were to measure them you would find that the hypercardioid polar response is 2x further from the sound source than the omnidirectional polar response just as the graph shows, and the lobar/shotgun polar response is 3x further from the sound source than the omnidirectional polar response just as the graph shows.]
Moving beyond the omnidirectional polar response and along the line of the direct sound, we see a dot representing the subcardioid polar response. It has a Distance Factor of 1.2 which means it must be placed 1.2x further from the sound source than the omnidirectional microphone, or 1.2 x d, if we want it to capture the same balance of direct sound and reverberation. If the omnidirectional was 1m from the sound source and captured an equal balance of direct sound and reverberation, the subcardioid would have to be 1.2 x 1m = 1.2m from the sound source to capture the same balance of direct and reverberation. Likewise, if the omnidirectional was 2m from the sound source, the subcardioid would have to be 1.2 x 2m = 2.4m from the sound source to capture the same balance of direct sound and reverberation.
As we move further along the line of direct sound we see the hemispherical polar response at 1.4 x d, the cardioid and bidirectional polar responses both at 1.7 x d, the supercardioid polar response at 1.9 x d, the hypercardioid polar response at 2.0 x d, and the lobar/shotgun polar response at 3.0 x d. Despite the considerable differences between them, each polar response on the illustration will deliver the same balance of direct sound and reverberation if it is placed on the same axis as the omnidirectional polar response but at the distance determined by its Distance Factor. If each polar response captures the same balance of direct sound and reverberation, will they all sound the same?
No, because there’s more to acoustics than the direct sound and the reverberation. As we move further from the sound source we lose high frequencies due to air absorption, so the direct sound captured from further away will be duller than the direct sound captured from closer. Also, all of the polar responses shown here (apart from the omnidirectional) are directional and will therefore suffer from the proximity effect to some degree – which means they’ll capture less low frequency energy when placed at distances greater than approximately 30cm from the sound source.
Both of the problems described above are relatively easy to solve with EQ if necessary; although sometimes they can work to our favour if the sound source is too bright or too boomy. There are other problems that are not so easy to fix, and to understand those we need to take a shallow dive into…
THE THREE Rs OF ACOUSTICS
Acoustics is the study of sound behaviour in enclosed spaces (i.e. rooms). Most of that behaviour depends on a) the frequency of the sound, b) the dimensions and shape of the room, c) what the room’s surfaces are made from, and d) the amount of sound absorptive materials within the room. The interaction of these parameters brings us the well-known acoustic phenomena of resonance, reflections and reverberation – which collectively form the Three Rs of Acoustics.
Acousticians and architects use the term ‘cuboidal room’ to describe any room that has six surfaces (four walls, a floor and a ceiling), and in which all adjacent surfaces meet at 90° – even if the room is not actually a cube. So why do they call it cuboidal? If all of the room’s surfaces were adjusted to the same dimensions the room would have six surfaces of equal size, all connecting at 90° – which is a cube. Hence a room with six surfaces and in which all adjacent surfaces connect at 90° can be described as cuboidal because it shares many of the same properties as a cube.
For the following shallow dive into room acoustics we’re going to assume a cuboidal room of rectangular shape (as used in the preceding illustrations), which is referred to as a rectangular cuboidal room. We’re also going to assume the room’s surfaces have sufficient mass and rigidity to reflect frequencies below 20Hz – a theoretically convenient assumption that is actually quite difficult and expensive to achieve in practice.
With those qualifying remarks out of the way, let’s take a closer look at the Three Rs of Acoustics…
R1: Resonance
At low frequencies, where the wavelength is relatively large within the room, the sound energy behaves like huge waves moving back and forth between the room’s surfaces. At these frequencies resonant behaviour dominates, resulting in resonating frequencies or simply resonance.
Resonance occurs at any frequency that has a half-wavelength equal to one or more of the room’s dimensions (it also occurs at frequencies that have a half-wavelength equal to diagonal combinations of the room’s dimensions, but we’re not going to get Pythagorean here). Every resonance repeats at integer multiples of its fundamental frequency, creating harmonic resonances up until the wavelength becomes relatively small within the room – at which point the sound behaviour transitions from resonance to reflections (more about reflections shortly).
When a frequency is resonating the positive peaks of its waveform will always occur at one place within the room, and the negative peaks of its waveform will always occur at another place within the room. As a result, the waveform appears to be standing still – hence it is referred to as a standing wave. It appears to be standing still, but the resonating sound energy is actually moving back and forth over itself, re-tracing and overlapping the same waveform with every repetition. The overlapping waveforms reinforce, resulting in SPL increases of up to +6dB at the positive and negative peaks. Meanwhile, the points where the waveform crosses the zero point (between the positive peaks and the negative peaks) represent areas of no SPL (-∞dB) and are essentially nulls for that frequency.
If we place the microphone in a positive or negative peak of a standing wave we’ll capture a sound in which notes at or near the resonant frequency will boom out over other notes, and we’ll need to use EQ to fix them. Conversely, if we place the microphone in a null of a standing wave we’ll capture a sound in which notes at or near the resonant frequency will be too soft compared to other notes, and, again, we’ll need to use EQ to fix them. Moving the microphone to different positions within the room will capture different balances of the peaks and nulls of the standing waves.
A cuboidal room has three ‘modes’ of resonant behaviour, known as the axial modes, the tangential modes and the oblique modes. The axial modes are the most significant and the most problematic, and are therefore the modes we’ll be focusing on in this shallow dive into resonance…
The axial modes occur between any two opposing surfaces, therefore a cuboidal room has three axial modes: one along the axis of the room’s length, one along the axis of the room’s width, and one along the axis of the room’s height. Each axial mode will have a fundamental resonance at the frequency that has a half-wavelength equal to the room dimension it occurs within (i.e. length, width or height). If we know the room’s dimension we can calculate the fundamental resonant frequency for the axial mode with the following formula:
fr1 = v / (2 x d) Hz
Where fr1 is the fundamental resonant frequency in Hertz, v is the velocity of sound propagation in air in metres per second (344m/s at 21°C), and d is the length of the room dimension in metres.
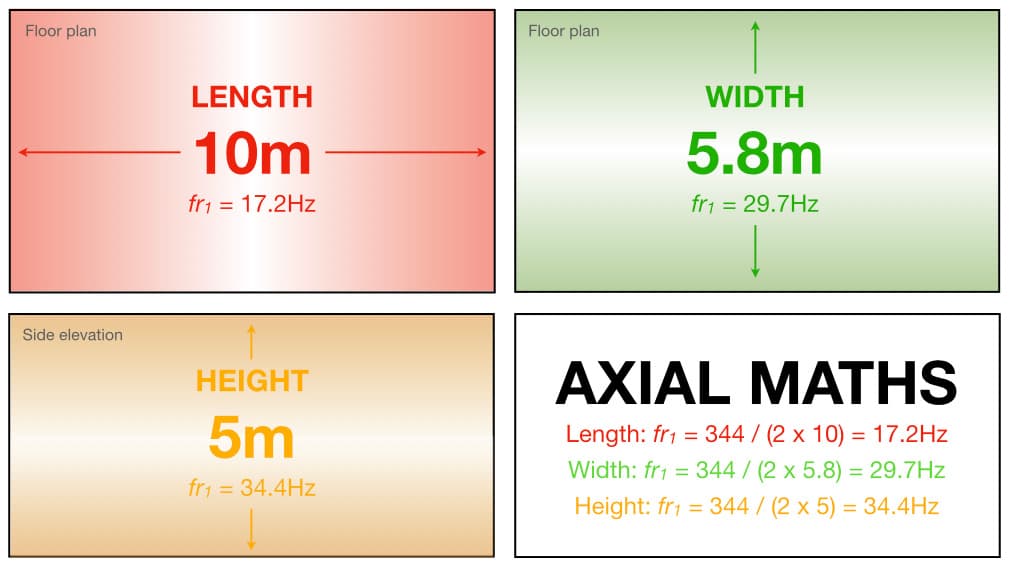
Let’s say a room has a length of 10m, a width of 5.8m and a height of 5m. Its fundamental axial mode resonances are shown in the illustration below:
…there’s more to acoustics than the direct sound and the reverberant sound.
The SPL of each resonant mode is represented with coloured shading. Darker shading represents higher SPLs (up to +6dB against the walls), while the white area through the centre of each illustration represents a null in the SPL (-∞dB). The axial mode for the room’s length is represented in red, the axial mode for the room’s width is represented in green, and the axial mode for the room’s height is represented in gold. Each of these fundamental axial mode resonances will be accompanied by harmonic resonances that extend higher into the frequency spectrum until reaching a frequency where the sound behaviour transitions from waves to reflections.
Contrary to popular belief, the surfaces do not have to be strictly parallel to create resonance; if they are facing each other and have sufficient mass and rigidity to reflect the sound energy, a resonance will occur between them. Hence they are usually referred to as ‘opposing surfaces’ rather than ‘parallel surfaces’. [Parallel reflective surfaces create the familiar ‘ping’ of flutter echo, which is a form of reflection not resonance.]
What does this have to do with Distance Factor? The following examples demonstrate the combined effects of Distance Factor, polar response and resonance. For these examples we will primarily focus on the axial mode resonances for the room’s length, with occasional reminders that the same process is occurring for the room’s width and height – each with its own fundamental resonance and harmonic resonances.
The illustration below is the same as the earlier illustration for Distance Factor except the reverberation (opaque blue) has been replaced with shades of red representing the SPL of the fundamental axial mode for the length of the room. As with the preceding illustration, darker shades of red represent higher SPLs for fr1 (up to +6dB), lighter shades of red represent lower SPLs for fr1, and the white areas represent nulls where fr1 is theoretically non-existent (-∞dB). The intensity of the red shading seen within each polar response shows how much of fr1 will be captured by that polar response at that position.
The illustration below shows the 2nd harmonic of the fundamental axial mode resonance. Because it is the 2nd harmonic its frequency is 2 x fr1, which we’ll call fr2. As we can see, it is simply two repetitions of the SPL behaviour seen for fr1 (above) squeezed into the same space. The SPL is still boosted by +6dB against the walls, as it is with all of the resonant modes, but now there is also a +6dB boost in the centre of the room – the same place where fr1 was in a null. Furthermore, at fr2 there are two nulls (represented by the two white vertical lines through the red shading).
As with the previous illustration, the intensity of the red shading seen within each polar response shows how much of fr2 will be captured by that polar response at that position. There is not much difference between the SPL of fr2 contained within each polar response (as indicated by the darkness of the red shading), but if we compare it against the previous illustration we can see that the cardioid, bidirectional and hemispherical polar responses are capturing significantly higher levels of fr2 than they are of fr1 – even though their placements haven’t changed. Their placements (which are based on using their Distance Factors to ensure each microphone captures the same balance of direct sound and reverberation) put them all very close to a null for fr1 but a peak for fr2, so they’ll be capturing significantly less of fr1 but significantly more of fr2.
If fr1 happened to be the frequency of an important note in the music, that note’s fundamental frequency would sound as if it has been cut with EQ while its second harmonic would sound as if it has been boosted with EQ – as would the fundamental frequency of the note an octave above it. If the notes at fr1 and fr2 were performed at the same level, they would be perceived as being different levels and/or tonalities depending on where the microphone was placed in the room.
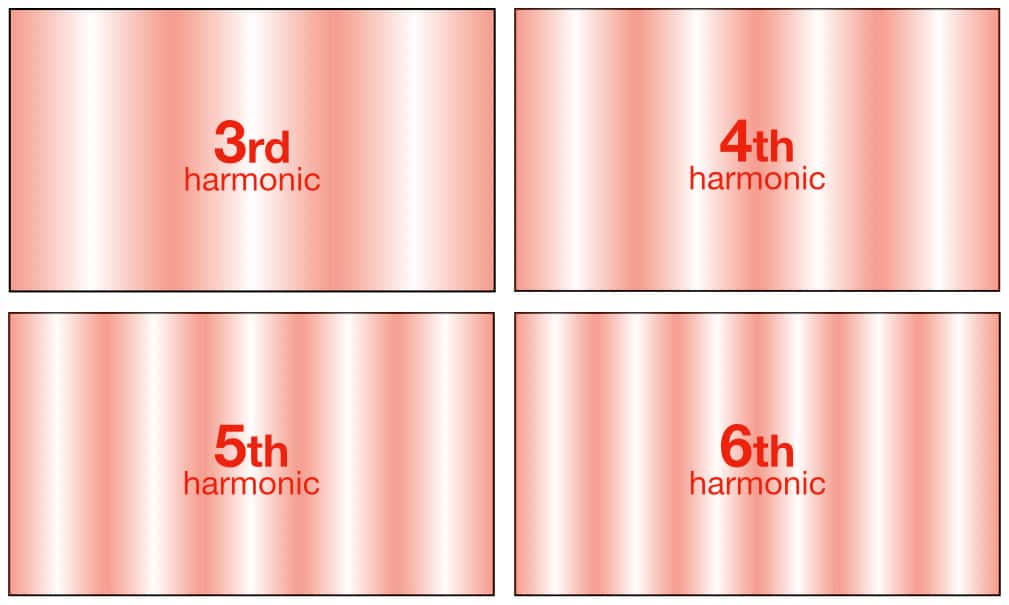
This resonant behaviour is not limited to fr1 and fr2, however. It will continue up the harmonic series at 3 x fr1 (i.e. fr3), 4 x fr1 (i.e. fr4), 5 x fr1 (fr5), 6 x fr1 (fr6) and so on, with each resonant mode creating its own series of peaks and nulls across the room’s length as shown below.
We can see from the illustrations above that even though the Distance Factor placements ensure each mic captures the same balance of direct sound and reverberation, the levels of the resonating frequencies could vary significantly between them and thereby affect the tonality of each microphone differently.
As a matter of interest, unwanted resonances are controlled by the strategic placement of tuned absorption. This typically consists of a sealed enclosure with a port or diaphragm that’s designed to resonate at the frequency that needs to be absorbed, and is typically placed in a peak of the resonance’s SPL. The enclosure contains absorptive material to dissipate any sound energy that is resonating within it, which it has, of course, taken out of the room. To understand why we need to use tuned absorption rather than a sheet of foam, we have to understand the scale of the problem. For example, let’s consider a resonance occurring at 20Hz. At a room temperature of 21°C, one cycle of 20Hz is 17.2m long and is travelling through the air at a velocity of 344 metres per second (that’s the velocity of sound propagation, aka ‘the speed of sound’, at 21°C). There are 20 of them occurring every second, and they’re all joined end-to-end to form the equivalent of an acoustic freight train travelling at the speed of sound through the room. No matter how much we want to believe the wish-casting for the cheap and easy ‘sheet of foam’ solution, the reality is that we’re not going to stop something that big and that fast by sticking a sheet of foam on a wall. That’s as futile as trying to stop a runaway bus by putting a line of traffic cones across the road. Resonance is just one part of the physics of sound, and that is why we have acousticians – but let’s get back to microphones…
R2: Reflections
As the frequency gets higher its wavelength gets shorter, eventually becoming relatively small within the room. At these frequencies the sound becomes more directional. Rather than creating resonance, it behaves like a ray of light reflecting off a mirror and therefore ray theory applies.
The basic rule for reflections is:
Angle of Reflection = Angle of Incidence
If the sound energy hits the wall at, say, 45° to the left side of the reflection point, it will be reflected at 45° to the right side of the reflection point. Similarly, if the sound energy hits the wall at 30° to the left side of the reflection point, it will be reflected at 30° to the right side of the reflection point. The reflected sound energy will be the mirror image of the incident sound energy.
Resonance is just one part of the physics of sound, and that is why we have acousticians…
The most problematic reflections are known as the first order reflections, where ‘first order’ means they have reflected off one surface only before reaching the microphone or listener. They are usually the first reflections to reach the microphone or listener after the direct sound, which means they have travelled the shortest distances of all of the possible reflections within the room. Therefore they will have the highest SPLs and the shortest delay times of all of the possible reflections within the room – a combination that makes them the biggest risk for audible comb filtering problems.
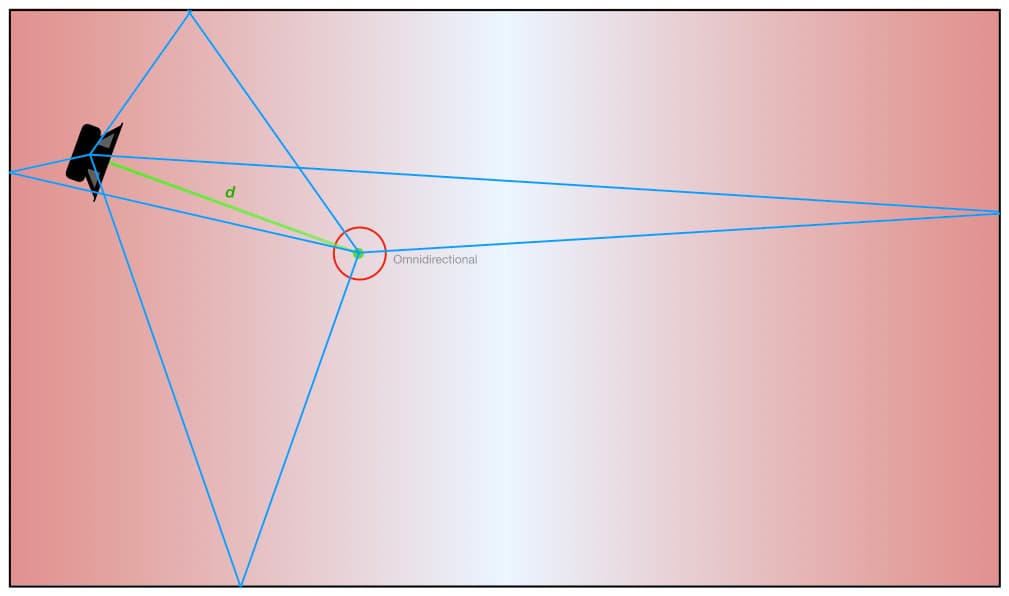
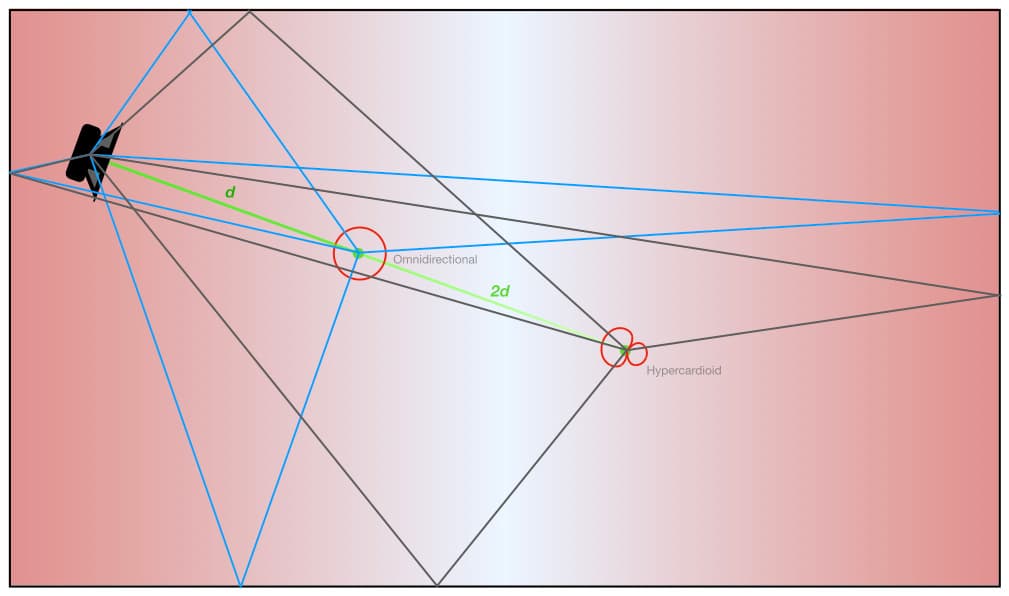
The illustration below shows the first order reflections that would occur between a sound source (a speaker) and an omnidirectional microphone placed within a room. Note that this ‘floor plan’ illustration only shows the first order reflections coming from the walls; there will also be first order reflections from the floor, the ceiling and any other large reflective surfaces within the room, but they’re not shown here. Also note that in this example the speaker has been offset from the centre line of the room to make the individual reflections easier to identify. If the speaker and the mic were both on the central horizontal axis of the image it would be harder to distinguish the first order reflections coming from the walls at the left and right sides of the illustration because those reflections would overlap each other and form a single horizontal line running through the illustration.
We can see that each reflection (shown in blue) behaves the same as a beam of light reflecting off a mirror, or a billiard ball bouncing off a cushion – assuming it has no spin.
Collectively, the first order reflections – and some of the reflections that follow them before the sound in the room reaches the onset of steady state energy (see ‘R3: Reverberation’ below) – are known as early reflections, and our ear/brain system uses them to create an impression of the size of the room and where we (or our microphones) are placed within it. What has this got to do with Distance Factor?
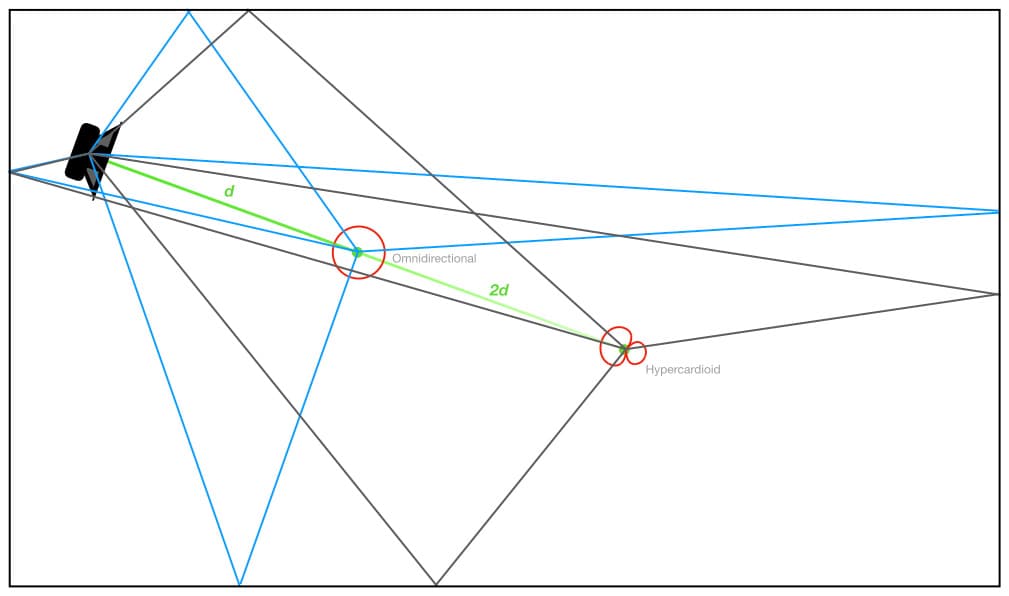
As we know, the Distance Factor allows us to determine how far we can place different polar responses from the sound source to ensure that each one captures the same balance of direct sound and reverberation. However, for any given room and sound source location, every different microphone position will capture a different set of early reflections. In the illustration below, a microphone with a hypercardioid polar response has been added to the previous illustration and placed twice as far from the sound source as the omnidirectional microphone, in accordance with the hypercardioid’s Distance Factor of 2.0. This placement ensures that the omnidirectional and hypercardioid polar responses will both capture the same balance of direct sound and reverberation. However, each captures a different set of early reflections with different arrival times and different SPLs. Despite having the same balance of direct sound and reverberation, the different early reflections will give the hypercardioid a different tonality to the omnidirectional while also creating a different sense of distance from the sound source and a different sense of location within the space.
The following illustration is the same as the previous illustration except the hypercardioid has been replaced with a cardioid placed at 1.7 x the omnidirectional’s distance from the sound source, in accordance with the cardioid’s Distance Factor. Both polar responses will capture the same balance of direct sound and reverberation, but, as with the previous example, they will capture different sets of early reflections and therefore will have different tonalities along with different impressions of distance from the sound source and location within the space.
The previous two illustrations make it easy to see the differences in the early reflections that arrive at each microphone. The further a reflection travels to reach a microphone the later its arrival time and its SPL (relative to the direct sound), and therefore the less potential it has to create comb filtering or other audible problems. However, we have not yet factored in the effect of the individual polar responses on the reflections they receive.
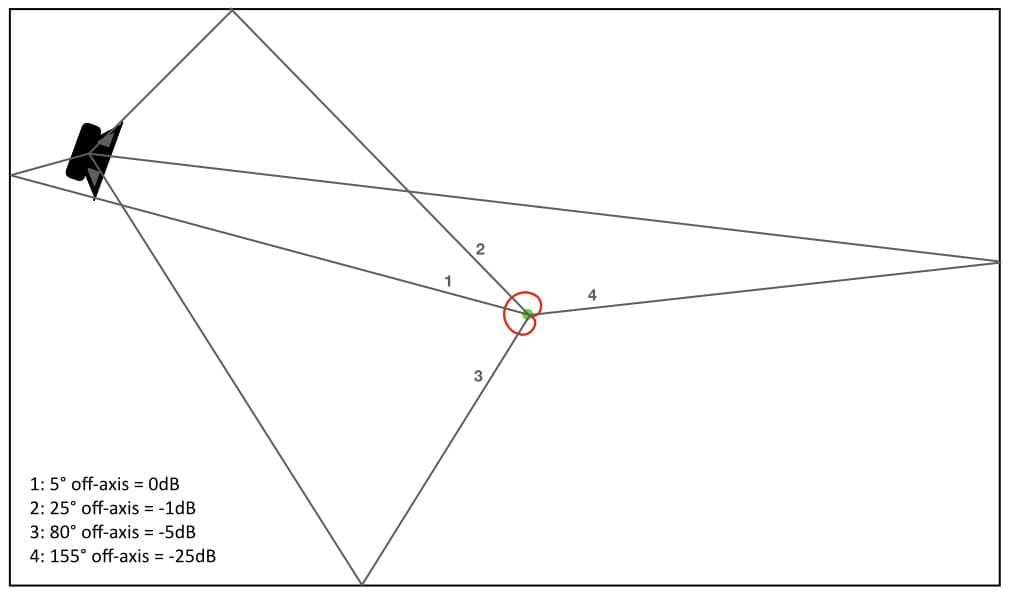
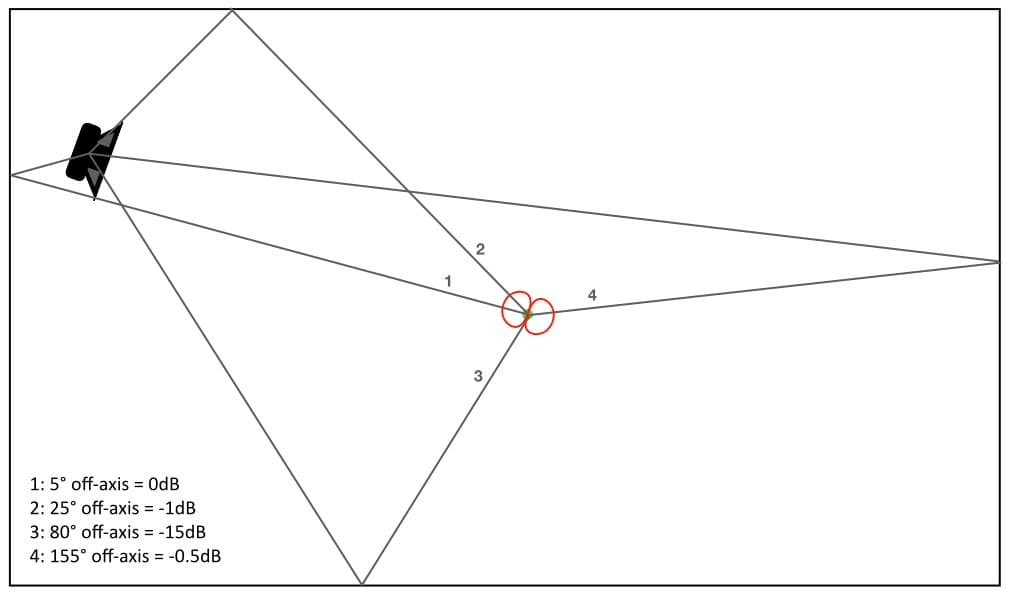
The illustration below is the same as the previous illustration but with unnecessary visual items removed (including the direct sound), and with each reflection numbered for easier identification. The figures in the bottom left corner show how much reduction each reflection receives due to the angle that it enters the cardioid polar response. The dB figures are approximate and have been rounded up or down as appropriate for the sake of clarity. We can see that reflections one and two are the strongest; both arrive within the cardioid polar response’s Acceptance Angle (±60°) and will therefore have less than 3dB of reduction. Reflection three arrives at approximately 80° off-axis and will be reduced by -5dB, while reflection four is reduced by about -25dB and is probably insignificant – especially if we factor in its loss of SPL due to the considerably longer distance it has travelled compared to the other reflections (we’ll save that mathematical gymnastics for a later instalment).
Importantly, the cardioid and bidirectional polar responses have the same Distance Factor, so putting them at the same distance from the sound source means both will capture the same balance of direct sound and reverberation. They’ll also receive the same early reflections, but will those reflections be captured in the same balance? No.
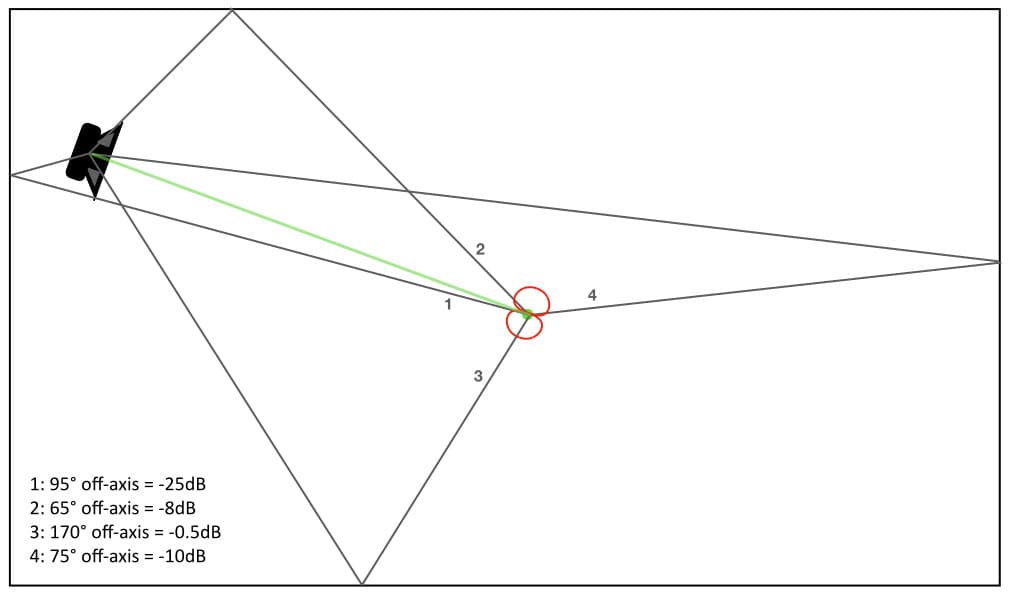
The illustration below replaces the cardioid polar response from the illustration above with the bidirectional polar response. As with the previous illustration, reflections one and two arrive within the bidirectional polar response’s Acceptance Angle (±45°) and will therefore have less than 3dB of reduction. Things are different with reflections three and four, however. Reflection three will receive about 15dB of reduction, while reflection four will receive less than a dB of reduction.
Switching from cardioid to bidirectional in this example has had little effect on reflections one and two, but a significant impact on the balance of reflections three and four. The two different polar responses, in the same location, capture the same balance of direct sound and reverberation, but different balances of the same early reflections.
The illustration above shows what happens when we change the angle of the microphone. In this case, we have rotated the bidirectional polar response by 90°; the kind of thing that might happen when a well-meaning non-engineer mistakes your Royer R121 for a shotgun mic and re-adjusts its angle to aim the end of the mic at the sound source. As we can see, the direct sound (green) has been completely rejected by the bidirectional’s side null, while the balance of the reflections it captures is significantly different. We’ll delve further into these kinds of on-axis and off-axis polar response calculations in a forthcoming instalment of this series.
As a matter of interest, unwanted reflections can be controlled by the strategic placement of broadband absorption to absorb the reflection (i.e. sticking sculpted open cell foam on the reflection point), or by the use of appropriately angled surfaces to re-direct the reflection elsewhere (angled walls, portable baffles and gobos with a reflective surface), or by the use of diffusion to scatter the reflected energy in numerous directions (irregular surfaces, quadratic residue diffusors, etc.). Reflections are just part of the physics of sound, and that is why we have acousticians – but let’s get back to microphones…
R3: Reverberation
If the sound source is continuous (let’s say the speaker is reproducing a 1kHz sine wave at a constant SPL) the sound energy will continue reflecting around the room, creating new pathways in accordance with the ‘angle of reflection = angle of incidence’ rule, until the reflections eventually fade out. Each reflection is like a billiard ball rolling across the table and bouncing off the cushions until it eventually dissipates all of the energy that made it start moving – at which point it has rolled to a stop. [The difference between the reflection and the billiard ball in this analogy is that the reflection does not slow down as it loses energy, it maintains the same velocity but loses SPL instead. Where the billiard ball rolls to a stop, the reflection fades to inaudibility.]
Eventually there will come a point where the sound energy travelling around the room is being dissipated ‘out’ of the room (by absorption, transmission through walls, and the Inverse Square Law) at the same rate that it is being put into the room by the sound source (e.g. a speaker). The overall sound energy in the room reaches a ‘break-even point’ where energy in = energy out, resulting in a consistent SPL. This point in time is known as the onset of steady state energy, and is the beginning of reverberant behaviour in the room. If the sound source suddenly stops we’ll clearly hear the characteristic sound of reverberation as hundreds, perhaps thousands, of individual reflections are absorbed out of the room – fading to silence one after another.
For any given room, the level of the reverberation and how long it takes to dissipate after the sound source stops (aka the reverberation time or Rt60) is determined by the amount of absorption in the room. This includes the absorptive contribution of tuned absorbers that are designed to control resonances, the absorptive contribution of broadband absorption and diffusion that has been placed to control early reflections, the absorption of soft furnishings, and also the absorptive contribution (if significant) of people within the room. In most cases, additional absorption and/or diffusion will be placed around the room to achieve the desired reverberation curve (a graph of reverberation time vs frequency). Getting the correct reverberation curve (as represented on a graph of reverberation time versus frequency) for the room’s intended purpose is just part of the physics of sound, and that is why we have acousticians – but let’s get back to microphones…
Reflections are just part of the physics of sound, and that is why we have acousticians…
R is for Revision
So the Three Rs of Acoustics are resonance, reflections and reverberation. What do they have to do with Distance Factor?
We know that reverberation is used as a reference to define the Distance Factor, and we know that the reverberation’s SPL won’t change no matter where the microphone is placed within the room – assuming it is a true diffusive field.
We also know that, for any given location of the sound source within the room, different microphone locations will result in different balances of the direct sound, the resonances and the reflections relative to the level of the reverberation. As a matter of interest, it also works the other way: for any given placement of the microphone within the room, different locations of the sound source will result in different balances of the direct sound, the resonances and the reflections relative to the level of reverberation captured by the microphone. In other words, moving the microphone and/or the sound source will affect the balance of direct sound, resonance and reflections (relative to the reverberation) captured by the microphone.
This same acoustic behaviour has major ramifications in control room design because the placement of the monitor speakers and the placement of the listening position both have an impact on the monitored sound heard by the engineer. Getting those monitor and listening positions right is just part of the physics of sound, and that is why we have acousticians – but let’s get back to microphones…
MICS ARE ACOUSTIC SUMMING MIXERS
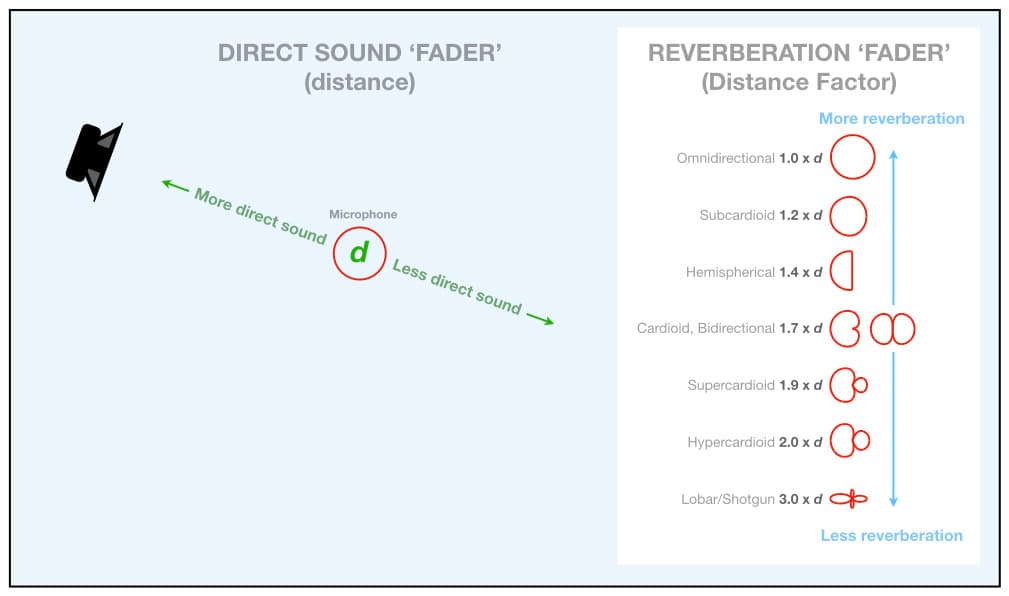
The illustration below shows an omnidirectional polar response placed at a distance d from the sound source. We can think of this microphone as a two-channel acoustic summing mixer with one input for the direct sound and one input for the reverberation.
The ‘fader’ for adjusting the level of the direct sound is the distance between the sound source and the microphone: changing the microphone’s distance from the sound source changes the level of the direct sound it captures without affecting the level of the reverberation.
The ‘fader’ for adjusting the level of the reverberation is the Distance Factor: for any given distance, changing the microphone’s Distance Factor will change the level of the reverberation it captures without affecting the level of the direct sound.
Getting the correct reverberation curve for the room’s intended purpose is just part of the physics of sound, and that is why we have acousticians…
Sound engineering would be easy if we only had to work with the direct sound and the reverberation. Moving the microphone closer to the sound source would give us more direct sound relative to the reverberation, moving the microphone further from the sound source would give us less direct sound relative to the reverberation, and changing the microphone’s Distance Factor would allow us to increase or decrease the amount of reverberation at any given microphone location: a lower Distance Factor will capture more reverberation, and a higher Distance Factor will capture less reverberation. If we liked the direct sound of an instrument at a particular miking distance but wanted more or less reverberation, we could simply choose a polar response with a different Distance Factor.
The only practical situation that allows us to work primarily with the direct sound and the room’s reverberation is distant miking in a concert hall or similar venue. It’s an acoustically large space, big enough to ensure that a) all fundamental resonant frequencies are below the audible bandwidth, b) first order reflections from the walls and ceiling have to travel so far from the sound source to the microphone that they’re rarely a problem, and c) some acoustic instruments require first order reflections off the stage floor and into the room to reinforce their SPL in the room. In these idealised circumstances, changing the distance between the microphones and the sound source, and/or changing the microphones’ Distance Factors (by changing their polar responses), allows us to alter the balance of direct sound and reverberation. In the concert hall situation the Distance Factor in practice approaches the Distance Factor in theory – at least as far as we’ve defined it here.
Apart from concert halls and similar acoustically large spaces, we are often limited to working in acoustically small spaces where resonance and reflections can be problematic.
To represent a frequency properly we must be able to fit at least half a wavelength of that frequency into the room. Therefore, for the purposes of this discussion, we will consider a room to be ‘acoustically small’ if any of its dimensions (i.e. length, width or height) is less than 8.6m and therefore cannot fit a half-wavelength of 20Hz – which is the lowest frequency of interest for most audio applications. A room may seem big to us as human beings, but if one or more of its dimensions is less than 8.6m it will be sonically claustrophobic to sound energy at 20Hz (remember, one cycle of 20Hz is 17.2m long in the air). In acoustically small spaces we can expect audible room resonances that will require tuned absorption to control them. We can also expect problems from first order reflections because they have travelled relatively short distances and will therefore have short arrival times accompanied by significant SPLs, meaning we need to listen carefully for comb filtering problems and a general ‘roomy’ or ‘boxy’ tonality. Broadband absorption and/or diffusion will be required to control the first order reflections, and more will then be added to bring the room’s reverberation curve to specification.
Most multitrack studios that are designed for recording popular music use acoustically small rooms. The engineer deals with the above-mentioned problems by a) careful placement of instruments and microphones within the room to minimise the effects of resonant modes, b) close-miking techniques with directional microphones to minimise the capture and significance of off-axis sounds, and c) the use of portable gobos (used as isolators, absorbers, diffusors and/or deflectors) to prevent first order reflections and spill from reaching the microphones. Similar close-miking and isolation techniques are used on stage when providing sound reinforcement. We’ll be looking at these studio and stage techniques in a forthcoming instalment of this series.
In most of the above cases (the concert hall and the multitrack recording studio) there has been acoustic treatment applied to control some or all of the Three Rs, which can make a significant improvement if done right and might even make many of the above-mentioned problems go away.
SUMMING IT ALL UP…
Let’s get back to a worst-case scenario where there has been no acoustic treatment. The illustration below is the same as the previous illustration, but the opaque blue background that represents the room’s reverberation has now been overlaid with the fundamental resonance of the room’s length, fr1, in red, and the first order reflections from the sound source to the microphone in dark blue.
... we will consider a room to be ‘acoustically small’ if any of its dimensions (i.e. length, width or height) is less than 8.6m…
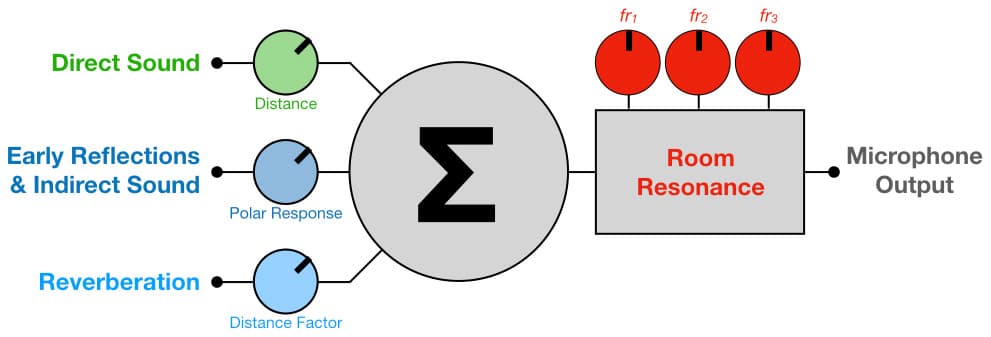
From this we can represent the microphone as a three-channel acoustic summing mixer with inputs for direct sound, early reflections, and reverberation, along with an equaliser on the output to represent the effects of resonances. Where we place the microphone, which Distance Factor we choose, which polar response and which angle we use all affect how those three inputs will be mixed and how much the resonances will affect the low frequency spectrum of the signal presented at the output of the microphone.
Note that the input for the early reflections also includes ‘indirect sound’, which allows for other sounds occurring in the room that are arriving off-axis (other musical instruments, audience noise, etc.) and which we might want to minimise by choosing a polar response that puts a rejection null facing the unwanted sound source.
[If we wanted to get hyper-detailed with this ‘summing mixer’ analogy we could include separate inputs for each of the first order reflections and for each source of indirect sound/spill, allowing us to control their individual levels based on their angle of incidence to the microphone’s polar response. We don’t need to do that here, but we will be calculating these types of things in a forthcoming instalment of this series.]
It is important to remember that knowing a microphone’s Distance Factor does not always mean you can assume its polar response. The cardioid polar response and the bidirectional polar response both have the same Distance Factor of 1.7, but have very different rejection nulls and acceptance angles. As we saw earlier, if placed in the same position in the room, each will capture the same balance of direct sound and reverberation but a different balance of early reflections and other indirect sounds.
The illustration below adds a second mic – a hypercardioid – on the same axis as the omnidirectional but at twice the distance from the sound source, as shown in an earlier illustration. Because the hypercardioid has been placed in accordance with its Distance Factor of 2.0 (i.e. at twice the distance of the omnidirectional from the sound source), it will capture the same balance of direct sound and reverberation as the omnidirectional, but, as we can see in the illustration, there will be slightly different levels of resonance (represented as different shades of red within each polar response) and a significantly different set of early reflections with their own arrival times and SPLs.
The illustration below is the same as the previous illustration but with the 2nd harmonic of the resonance (fr2) overlaid in place of the fundamental (fr1). Both mics capture the same balances of direct sound, fr1, reverberation and early reflections as seen in the previous illustration, but we can see that the levels of fr2 in both mics will be slightly higher than the levels of fr1 shown in the previous illustration, meaning notes at or close to the frequency of fr2 will be louder than notes at or close to the frequency of fr1 in the output signal from the microphone.
The illustration below is the same as the previous two illustrations but with the 3rd harmonic of the resonance (fr3) overlaid in place of the fundamental (fr1) and the 2nd harmonic (fr2). Both mics capture the same balances of direct sound, fr1, fr2, reverberation and early reflections as they did in the previous illustrations, but we can see that the levels of fr3 in both mics will be significantly higher than the levels of fr1 and fr2 as shown in the previous illustrations. The omnidirectional microphone is almost on top of a peak in fr3, while the hypercardioid is also capturing a much stronger amount of fr3 compared to levels of fr1 and fr2 it is capturing.
Moving either of the microphones in the above illustrations to different positions within the room will result in different balances of direct sound, resonances and reflections relative to the level of the reverberation – as will changing the polar response or even simply changing the direction the microphone is facing. The microphone is, essentially, a passive summing mixer with an EQ on the output, and we control the mix and the EQ by where we place the microphone in the room and which polar response and Distance Factor we choose.
SUMMARY
Distance Factor is a simple yet binding concept that brings together a significant amount of audio theory and practice in a way that few other audio concepts can. There’s not a lot to say about the Distance Factor, but there’s a lot to say around it.
The placement of the sound source within the room determines which resonances and reflections it creates, and where we place the microphone determines which resonances and reflections it captures. The polar response determines how much of the early reflections and indirect sound the microphone captures, and the Distance Factor determines how much reverberation it captures. Small changes in distance, angle, polar response and Distance Factor can make big differences to the captured sound.
The next time you’re making a slight change to a microphone’s distance or angle and some dumbass musicians cynically scoff “as if that’s going to make any difference”, remember those same dumbasses are paying you to do something they cannot do – capture an acceptable sound quickly and consistently based on an understanding of the complex relationships between the sound source, the polar response, the resonances, the reflections and the reverberation. That is why we are sound engineers – but let’s get back to microphones…
There’s not a lot to say about the Distance Factor, but there’s a lot to say around it.
SCALING THE DISTANCE FACTOR
All of the polar responses shown throughout this instalment have been reproduced to scale, where the 0° on-axis point represents the same level of 0dB. If placed in the same position, and on-axis to the same sound source, each will produce the same output level from the direct sound (assuming they all had the same Sensitivity and were given the same gain). The size differences in their visual representations therefore indicate how much indirect sound, reflections and reverberation each polar response captures compared to the level of direct sound.
The lobar/shotgun polar response looks considerably smaller than the omnidirectional polar response because it captures considerably less of the surrounding sound field, but if both mics had the same Sensitivity and were placed at the same distance from the sound source, and if both mics’ preamps were set to the same gain, both mics would capture and output and the same level of the direct sound.
When viewed to scale this way, we can see that as the polar responses become more directional they don’t really become more sensitive to on-axis sound; rather, they become less sensitive to off-axis sounds. And that’s what the Distance Factor tells us…















RESPONSES