
Microphones: Hertz & dBs
In the fourteenth instalment of this on-going series, Greg Simmons begins a deep dive into the relationships between a microphone’s frequency response, polar response and off-axis response.
Over the last five instalments of this series we’ve explored numerous concepts related to microphone preamplifiers, signal levels and gain structure. In the process we’ve avoided introducing any more microphone parameters and focused instead on matching the microphone’s Sensitivity, Equivalent Noise Level (aka Self Noise) and Maximum SPL to the sound source and the preamplifier – all with the goal of reducing noise and/or increasing headroom. In this instalment we return to microphone parameters with an emphasis on frequency response and related parameters such as proximity effect and measurement distance. We’ll also look at application profiles, tailored frequency responses and more…
FREQUENCY RESPONSE
In the fifth instalment of this series we looked at microphone Sensitivity, which tells us how much voltage (electrical signal) will be present at the microphone’s output when a sine wave with a frequency of 1kHz and an SPL of 94dB is present at the microphone’s diaphragm. An SPL of 94dB is equivalent to one Pascal (1Pa) of atmospheric pressure, so Sensitivity measurements are often defined in volts per Pascal. However, because the voltage coming out of the microphone is very small and typically measured in thousandths of a volt, it is represented as mV for milliVolts (thousandths of a volt), so a microphone’s Sensitivity measurement is typically given as mV/Pa. For example, Shure’s SM7B has a Sensitivity of 1.1mV/Pa, which means it outputs 0.0011 volts when the sound source is a sine wave that creates an SPL of 94dB at the diaphragm and has a frequency of 1kHz.
A microphone’s frequency response is an expanded version of its Sensitivity measurement, using frequencies throughout the range of human hearing (20Hz to 20kHz) rather than just 1kHz. It ultimately shows us how the microphone’s Sensitivity changes with frequency – in other words, which frequencies the microphone is more sensitive to and therefore produces a higher output signal level, and which frequencies it is less sensitive to and therefore produces a lower output signal level.
The method for measuring a microphone’s frequency response is simple in concept. The microphone is placed in front of a speaker that reproduces a ‘sweep tone’, i.e. a sine wave that typically starts at 20Hz and slowly increases, or ‘sweeps’, up to 20kHz while maintaining a consistent SPL at the microphone’s diaphragm. As the frequency sweeps from 20Hz to 20kHz, the amplitude of the signal coming out of the microphone is measured and plotted on a graph of frequency versus amplitude.
The result is typically referred to as a frequency response curve (it’s still called a ‘curve’ even if it’s a straight line), and shows us how well the microphone responds to some frequencies compared to other frequencies. It provides an overall impression of the microphone’s tonality (bright, dull, etc.) which is useful for comparison and mic selection purposes. It does not factor in harmonic distortion and other parameters that contribute to a microphone’s tonality, but those parameters make relatively small contributions compared to the frequency response.

The frequency response measurement is typically made in an acoustically-isolated anechoic chamber that prevents interference from external sounds and does not create any resonances, reflections or reverberation of its own that would adversely influence the sound captured by the microphone.
The amplitude of the microphone’s output signal at 1kHz is used as the reference, which becomes the 0dB reference line for the frequency response curve. Therefore, a frequency response curve should always read 0dB at 1kHz – although some manufacturers prefer to use the absolute value of SPL (e.g. 94dBSPL) rather than the relative value of 0dB as the reference level for 1kHz.
A microphone’s frequency response is an expanded version of its Sensitivity…

The illustration above shows a theoretically perfect frequency response curve, as expected of a microphone designed to capture a sound very accurately (i.e. for speaker test and measurement purposes, making very accurate recordings, etc.). The frequency is shown on the horizontal axis; in this example it extends from 20Hz to 20kHz. The amplitude of the microphone’s output signal is shown on the vertical axis; in this example it extends from +15dB to -15dB (also referred to as ±15dB) with 0dB in the middle. The frequency response curve (shown in blue) is a straight horizontal line extending from 20Hz to 20kHz. Projecting up to the frequency response curve from any frequency on the horizontal axis and looking across to the vertical axis shows us that the amplitude of the microphone’s output signal remains the same regardless of the frequency. This microphone captures all frequencies within the range of human hearing equally well – it does not favour some frequencies over others, and therefore should not affect the tonality of the captured signal. This is referred to as a flat response because it is essentially a flat line.
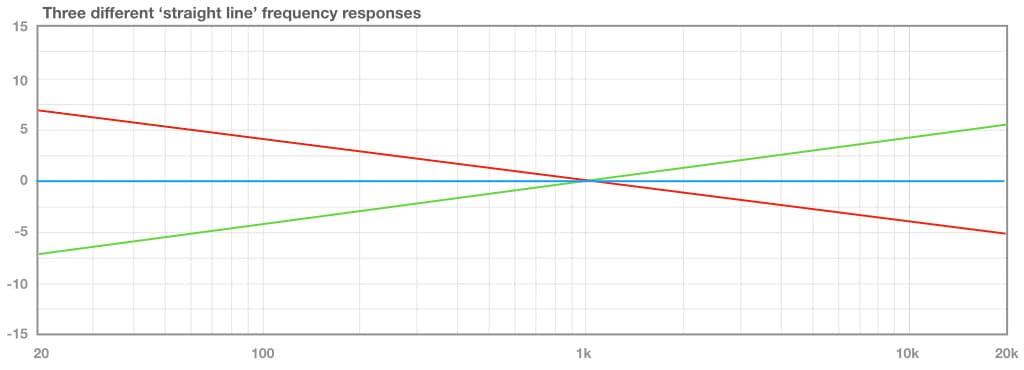
The illustration below shows three different frequency response curves that are all perfectly straight lines, but only one of them is a flat response.
The green response tilts upwards, indicating a steady increase of output level from the microphone as the frequency gets higher. A microphone with this frequency response would sound very bright and lacking in low frequency energy, and might be described as sounding tinny or thin due to the way it exaggerates high frequencies – although it might be a good choice for use with a sound source that is too dull or boomy.
The red response tilts downwards, indicating a steady decrease of output level from the microphone as the frequency gets higher. A microphone with this frequency response would sound dull and lacking in high frequency energy, and might be described as sounding boomy due to the way it exaggerates low frequencies – although it might be a good choice for use with a sound source that is too tinny or thin.
The blue response is a horizontal line, meaning it reproduces all frequencies equally well and therefore offers a flat response – a microphone with this frequency response would be described as providing an accurate representation of the sound at the microphone position. Interestingly, however, many sound engineers would not say it sounds ‘natural’ because, subjectively, ‘accurate’ does not necessarily equate to ‘natural’. Ribbon microphones, with their gentle high frequency roll-off, are more often described as sounding ‘natural’ – a phenomenon we’ll return to later in this instalment.
Smoothing
A microphone’s frequency response curve is rarely a perfectly straight line, even when it’s meant to be ‘flat’. As we saw in the earlier instalments of this series, microphones contain parts that need to move very fast (i.e. capturing up to 20,000 vibrations per second), and moving parts introduce the problem of resonance – which will exaggerate some frequencies and thereby affect the frequency response. Furthermore, the microphone’s physical construction provides its own acoustic environment that also affects the frequency response – think of it as room acoustics on a miniature scale.
Due to these things the frequency response curves of most microphones will contain numerous peaks and dips within the audible range, many of which will manifest as spikes (upwards or downwards) and ripples. Some of these will be due to the microphone itself, others will be due to artefacts caused by the measuring equipment or the measurement process. Many of these irregularities are too low in amplitude or too narrow in bandwidth to have any sonic significance, and including them on a frequency response curve only causes unnecessary concern. For this reason a process known as smoothing is often applied to remove or downplay these insignificant irregularities – essentially ‘smoothing out’ the frequency response curve (like going over it with sandpaper) to provide a better indication of what the microphone sounds like in practice. However, be aware that the smoothing process can be over-used to deliberately downplay peaks and dips that are significant and audible.
Deviation Window
There are times when it is not necessary to have a graphical representation of a microphone’s frequency response – we are simply interested in knowing how much a microphone deviates from the theoretical ideal of a flat response, and we’re not concerned with the actual frequencies it deviates at. In these cases, a written specification is sufficient. It provides a ‘big picture’ of how much the microphone’s frequency response curve deviates either side of the 0dB reference within a certain bandwidth (typically 20Hz to 20kHz).
In the illustration below we can see that the peaks and dips of the curve never exceed 1dB either side of the 0dB reference, from 20Hz to 20kHz. This microphone’s frequency response could be summarised as ‘20Hz to 20kHz ±1dB’. From its highest peak to its lowest dip, the deviation window never exceeds 2dB (from +1dB to -1dB) from 20Hz to 20kHz.
A microphone’s frequency response curve is rarely a perfectly straight line…

The curve shown below is more extreme and deviates up to 3dB either side of the 0dB reference. Its frequency response would be summarised as ‘20Hz to 20kHz ±3dB’. From its highest peak to its lowest dip, the deviation window never exceeds 6dB (from +3dB to -3dB).

The curve below is for a microphone that has a very good response but slightly narrower bandwidth than the earlier ±1dB curve. We can see that the response remains within the ±1dB window except at the upper and lower frequency extremes, where it rolls off to -3dB at 20Hz and 20kHz respectively. This response would be described as ‘20Hz to 20kHz +1dB/-3dB’, meaning it never rises more than 1dB above the 0dB reference and never falls more than 3dB below it. In this example the frequency response is actually very good (remaining within ±1dB from 30Hz to 10kHz), and those 3dB drops are purely due to roll-offs at the high and low frequency extremes. They’re probably not worth worrying about unless the intention is to accurately capture the low and/or high frequencies that exist below 30Hz and above 10kHz.

Frequency Range
When a microphone’s frequency response is specified in text as upper and lower frequency limits within a deviation window, as described above, it is often referred to as a frequency range.
Some manufacturers have dumbed this down to the point that the specification is devoid of any deviation window, rendering it meaningless. For example:
Frequency Range: 20Hz to 20kHz
It’s not a problem if the published specifications include a frequency response curve where the viewer can see how the microphone responds to different frequencies, but without a frequency response curve and without a stated deviation window this type of specification is nothing more than a ‘feel good’ exercise for a technically uninformed market. “Does this car go fast?” “Yes.” “I’ll take it.”
PROXIMITY EFFECT
No discussion of microphone frequency response would be complete without considering the proximity effect. It was discussed briefly in the first instalment of this series, so let’s start by re-visiting that…
As the name suggests, the proximity effect refers to the effect of the distance between the microphone and the sound source. It’s responsible for the well-known boost in low frequencies that occurs when speaking very close to a microphone. It’s also responsible for the lesser-known loss of low frequencies that occurs when miking from a distance. As a generalisation, as the microphone’s polar response becomes more directional the proximity effect becomes greater.
The cause of the proximity effect will be explained in a forthcoming instalment that discusses how microphones create their polar responses. For now, think of the proximity effect as a dynamic EQ that progressively boosts the low frequencies as you get closer to the microphone and progressively cuts the low frequencies as you move away from it. Typically beginning somewhere below 1000Hz and reaching boosts or cuts of 12dB or more at 50Hz, the proximity effect has a major effect on the tonality of the sound captured by the microphone – especially when close-miking a sound source that is capable of moving closer to and further from the microphone, such as a vocal or any hand-held instrument (e.g. saxophone, flute, etc.). Many musicians learn to ‘play’ the proximity effect during their performance, moving closer and further from the microphone to get the desired tonality for any given moment. Changing the distance literally changes the microphone’s frequency response.
The proximity effect should always be kept in mind when measuring or considering the frequency response of a directional microphone, because it affects the amount of low frequencies captured by the microphone. A measurement made very close will have an exaggerated low frequency response, while a measurement made at a distance will have a poor low frequency response. For this reason, it is always important to know what distance the frequency response was measured at and how that relates to your application.
…think of the proximity effect as a dynamic EQ…
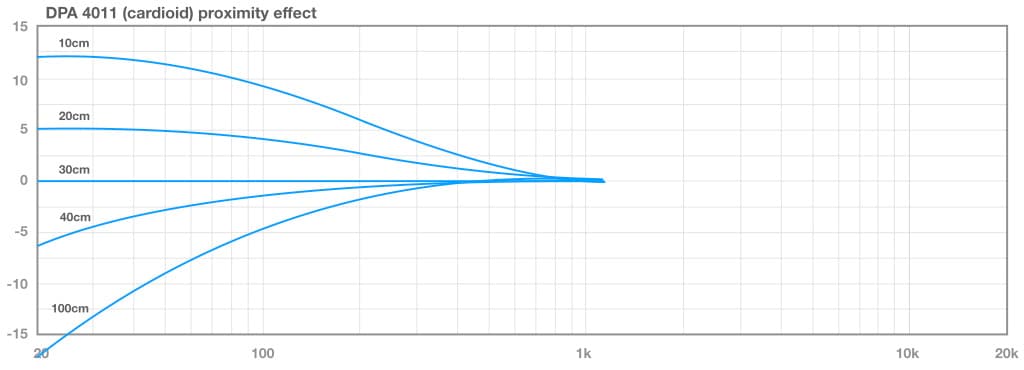
The illustration above shows how the low frequency response of a microphone with a cardioid polar response changes with distance – in this case the microphone is DPA’s 4011 small single diaphragm cardioid condenser. At a distance of 10cm the 4011’s response rises to +12dB at 20Hz, while at 100cm it falls to -18dB at 20Hz. That’s a difference of 30dB (from +12dB to -18dB) over a distance of 90cm (from 10cm to 100cm), and is typical of most microphones with a cardioid polar response. Note that the response is flat at 30cm, which is a pivotal distance for measuring the frequency response of a cardioid microphone because it’s the transitional distance where the proximity effect is not increasing or reducing the low frequencies. This brings us conveniently to…
MEASUREMENT DISTANCE
The illustration above, from DPA’s 4011, shows how a microphone’s low frequency response changes with distance due to the proximity effect. Note that each curve includes the distance it was measured at – without that information we’d have no idea what the frequency response would be for any particular application and distance.
For many decades every reputable manufacturer included the measurement distance with their microphone frequency responses. Nowadays we have to drill down deep into a manufacturer’s website to find such important qualifying information, often to discover it’s simply not there.

The illustration above demonstrates this problem. It overlays the frequency response curves of two popular small single-diaphragm cardioid condenser microphones, both of similar dimensions and applications but at significantly different price points. They are both real mics that have been on the market for many years, but for the purpose of this demonstration we’ll refer to them simply as the Red mic and the Green mic in accordance with the colour of their response curves. Both mics offer a flat response from 300Hz to 4kHz, followed by very similar upper midrange humps reaching around +2dB before starting a gentle roll-off at 10kHz and falling a dB or two below 0dB at 20kHz. The Red mic would have slightly more output than the Green mic between 5kHz and 6kHz, and slightly less output between 15kHz and 20kHz. We could expect very similar midrange and high frequency tonality from each microphone – at least as far as we can determine from the frequency response curves and their contribution to a microphone’s tonality. So far so good, but what about below 300Hz?
The Red mic drops 4dB from 300Hz down to 80Hz, at which point it levels out and remains consistent down to 20Hz. The resulting curve is reminiscent of a cut being applied by a low frequency shelving EQ. Meanwhile, at 300Hz the Green mic begins a low frequency roll-off that falls to -12dB at 20Hz. Which mic offers the best low frequency performance? The Green mic appears to offer better performance from 300Hz down to 55Hz, while the Red mic offers better performance below 55Hz. However…
Right about now alarm bells should be ringing in the heads of every reader who knows how to interpret a microphone’s frequency response graph. Something doesn’t look right… The Green mic’s low frequency roll-off looks like something we’d expect to see from a ‘free field’ measurement (see below) of a cardioid at 60cm or more from the sound source, where the proximity effect is rolling off the low frequencies significantly. Meanwhile, the Red mic’s extended low frequency response from 80Hz down to 20Hz looks like something we’d expect to see from a measurement made at 30cm or thereabouts, where the proximity effect is not boosting or cutting the low frequencies.
Drilling down into the respective manufacturer’s websites and downloading manuals, we find that the Green mic’s frequency response was indeed measured under ‘free field’ conditions (in accordance with the IEC60268-4 specification as discussed below). Unfortunately there is no mention of the measurement conditions on the Red mic’s web page or in its downloaded manual. This means we cannot make confident comparisons of these two frequency response curves because a) we don’t know if they were measured under the same conditions, and b) they don’t appear to be measured under the same conditions. Specifications are only comparable if everyone follows the same measuring techniques and/or includes the vital qualifying information in their marketing materials.
As shown above, the measurement distance is a crucial piece of information for evaluating the frequency response of any microphone that exhibits the proximity effect…
Something doesn’t look right...
APPLICATION PROFILES
In the sixth instalment of this series we saw that there’s an in-depth International Standard for microphone specifications that’s been in place since the 1960s. Known as IEC60268-4, it’s published by the IEC (International Electrotechnical Commission) and regularly updated by the AES (Audio Engineering Society). It describes precisely how every microphone specification should be measured, the units those measurements should be presented in, and what qualifying information should be included with the measurements – all with the goal of enabling meaningful objective comparisons between different microphones.
Interestingly, it also includes recommendations for describing a microphone’s application profile – in other words, what application the microphone is designed for. This is an important consideration because if we know the application that a microphone is designed for we can measure it in a way that’s relevant to that application. IEC60268-4 provides three example application profiles – free field, performance and close-talking – and each comes with a recommended measuring technique and distance.
Free Field Application Profile
The first application profile is for free field microphones, where ‘free field’ refers to a space that is free of any reflections, and the sound is arriving ‘on axis’ to the microphone, i.e. the microphone’s diaphragm is directly facing the sound source.
IEC60268-4 specifies that microphones designed for free field applications have their measurements made in ‘approximately plane progressive wave conditions’ – in other words, where the sound energy is free to propagate away from the sound source without encountering any interference that could create reflections. This can be achieved with a specially designed and acoustically treated duct, or in an anechoic chamber – provided it is large enough to support a half-wavelength of the lowest frequency being measured. The free field application profile doesn’t state a specific distance for microphone placement when measuring the frequency response, but does require it to be in the free field. This will typically place the microphone at a distance where we see the characteristic low frequency roll-off due to the proximity effect.
The most obvious use of this application profile is for test situations such as measuring the frequency response of a loudspeaker – which is done in an anechoic chamber similar to the approach shown earlier for measuring a microphone’s frequency response. The anechoic chamber has no reflections and the microphone is directly facing the sound source, both conditions that satisfy the requirement for a free field.

Performance Application Profile
The second application profile is for performance microphones. The implication here is hand-held vocal microphones, where the performer is able to change the microphone distance during the performance to take advantage of the proximity effect – although those same microphones are often mounted on a stand for performers whose hands are not free to hold a microphone (e.g. brass and woodwind players), and the performer moves the instrument towards or away from the microphone while performing to it.
The recommendation for measuring performance microphones is similar to the anechoic chamber method described earlier, but the speaker is replaced with an ‘artificial mouth’ or ‘mouth simulator’ – which is essentially a speaker mounted into an object that’s shaped to recreate the reflections and diffraction of a human face, perhaps even a dummy head and upper torso with a speaker where the mouth would be. This application profile requires a measurement distance of 30cm – the ‘break even’ distance for a cardioid where the proximity effect is not boosting or cutting the low frequency energy.

Close-Talking Application Profile
The third application profile is for close-talking microphones, which, as the name suggests, are intended for use at very short distances. As with the performance application profile described above, the measurements for close-talking microphones require the use of an artificial mouth but require it to be placed at a very short distance of 25mm to the microphone – which will definitely bring the proximity effect into play if the microphone is directional.

Other Applications…
You may have noticed that there’s no application profile for close-miking musical instruments that are fixed in position during a performance (drums, piano, guitar amplifiers, etc.), or that can move around the microphone but are not voices (e.g. brass and woodwind instruments) as is commonly done in the studio and on stage. The free field application profile does not rely on close-miking, while the performance and close-talking application profiles are clearly intended for vocals/voice and therefore require the use of an artificial mouth – which makes no sense for measuring the frequency response of a microphone intended for close-miking a drum kit, piano, guitar amplifier, saxophone, trumpet, or most other instruments for that matter…
For these situations the free field application profile provides all the information we need, especially if it includes the distance the measurement was taken at so we can consider the influence (if any) of the proximity effect at that distance. Miking an instrument in a studio or on stage is not using the microphone in a free field environment, but a microphone specification made in a free field environment remains useful because it tells us how the microphone responds in an ideal ‘on-axis’ situation with no reflections. This provides a basis we can use for selecting microphones for applications that are not free field. If the signal coming out of the microphone doesn’t sound like we’d anticipate (by mentally superimposing the microphone’s free field frequency response over the sound arriving at the microphone’s diaphragm while also considering the proximity effect), then we know something else is the problem – such as comb filtering due to reflections off nearby surfaces, or perhaps the microphone is damaged.
The purpose of the application profiles is to allow for situations where a free field measurement is not relevant, such as close-miking a voice. The IEC standard states that a manufacturer may create their own application profiles to measure and determine specifications of microphones that are designed for a specific application, as long as qualifying details about the measurement conditions are provided with the measurements.
Diffuse Field
Although not an application profile, some microphone frequency responses include a diffuse field curve. What is it and what does it mean? We’ve already seen that a free field measurement requires no reflections, so that the only sound that reaches the microphone is the direct sound from the sound source. Free field measurements are typically performed in an anechoic chamber, which is a room with highly absorptive walls to prevent any reflections or reverberation (as shown in the first image in this instalment).
The diffuse field is the opposite to the free field. In a diffuse field, sound energy can arrive at the microphone from any direction with equal probability and amplitude – the contribution of the direct sound is considered negligible relative to the contribution of the reflected sounds and the reverberation.
For diffuse field measurements the anechoic chamber is replaced with a reverb chamber (a large and highly reverberant room), and the sweep tone is replaced by third-octave bands of noise in short bursts that are intended to create reverberation. The measurements are taken immediately at the end of each noise burst, when there is no direct sound and the only sound in the room is the reverberation (i.e. a ‘diffuse field’).
The IEC standard recommends that the measurement room has the following reverberation times:

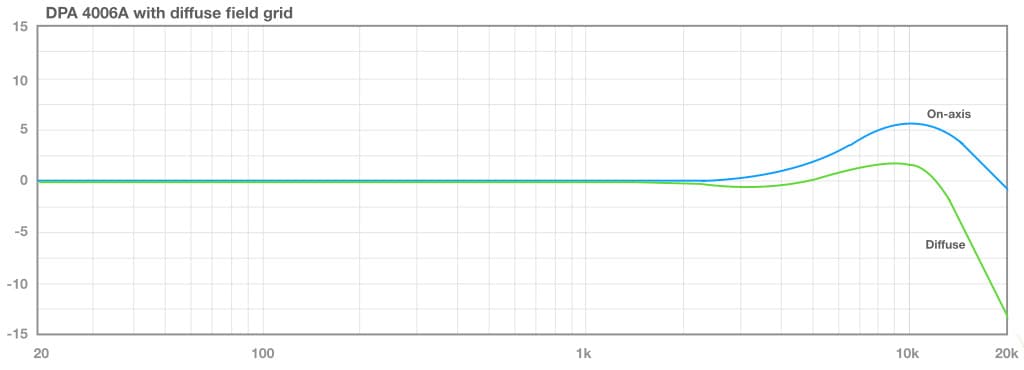
Some manufacturers, particularly those who make microphones intended for distant miking applications (such as recording orchestral, chamber and choral music), provide two frequency response curves: one measured in accordance with the free field application profile described above, and one measured in a diffuse field. DPA’s 4006A small single diaphragm omnidirectional condenser provides a good example, as shown below.

A frequency response graph like this is helpful when choosing a microphone for distant miking. The on-axis frequency response curve (blue) provides an indication of how the microphone responds to sounds arriving on-axis, while the diffuse field frequency response curve (green) provides an indication of how the microphone responds to the early reflections and reverberation arriving from different directions throughout the room. Note that the 4006A’s diffuse field frequency response curve shows a high frequency roll-off that begins at around 4kHz and falls to around -8dB at 20kHz. This is mostly due to air absorption of high frequencies, which we’ll look at shortly.
DPA provide a number of diffraction grids for the 4006A. These fit over the front of the microphone and alter its frequency response to suit different applications – there’s one for free field applications, one for diffuse field applications and one for close-miking applications. The frequency response curves shown above were made with the free field grid fitted, which is useful for capturing a balance between the sound coming off stage and the room’s reverberation – such as making a two-mic direct-to-stereo recording of an acoustic performance in a concert hall.
The frequency response curves shown below were made with the diffuse field grid fitted. Note the increased level at 10kHz. The diffuse field grid boosts the diffuse field frequency response by about 4.5dB at 10kHz, from -2.5dB (free field grid) to +2dB (diffuse field grid), which provides a more detailed capture of the diffuse field. It also adds a similar boost to the on-axis frequency response curve, but that shouldn’t be too significant in a diffuse sound field application. This grid is suited for applications where the 4006A is being used as a room microphone to be blended with closer microphones. In these applications the intention is to capture a diffuse room sound by placing the microphone(s) at a distance where the room’s reflections and reverberation are the dominant sound and there is very little direct sound, allowing the captured sound to be blended with the close mics without causing any problems – rather like adding reverb from a plug-in. Aiming the microphones away from the performers (e.g. directly upwards or to the back of the room) uses the grid’s on-axis boost to provide a more detailed capture of the diffuse field rather than emphasising the direct sound from the performers.
To be in the diffuse field, the microphone must be placed at a sufficient distance to ensure the contribution of the direct sound is negligible, as illustrated below.
As we move away from the sound source the direct sound’s SPL decreases in accordance with the Inverse Square Law, dropping by 6dB for each doubling of distance (shown in red). However, the reverberation’s SPL remains consistent throughout the room and therefore is not affected by the distance from the sound source (shown in green). As we move further away from the sound source and into the room, we reach a point where the direct sound’s SPL is equal to the reverberation’s SPL. In acoustics terminology this is known as the critical distance. At distances less than the critical distance we are in the near field, where the direct sound is dominant. [As a matter of interest, this is also the goal for ‘near field monitoring’.] Beyond the critical distance the reverberation becomes dominant and we have entered the far field. As we move further into the far field the direct sound becomes less and less significant. When the direct sound’s SPL is significantly lower than the reverberation’s SPL, the contribution of the direct sound becomes negligible and we are in the diffuse field.

DEVIATING FROM FLAT
Earlier in this instalment we discussed the importance of using a microphone with a flat response to capture the sound’s tonality as accurately as possible from the microphone position. However, there are many times when we rely on the microphone’s frequency response to alter the sound’s tonality – turning it into something more useful, more acceptable or more fashionable. Let’s look into that…
We’ll continue using DPA’s 4006A, as discussed above. The illustration below is the 4006A’s on-axis frequency response with the free field grid fitted, as shown earlier but this time without showing the diffuse field response.

From 10Hz to 5kHz the frequency response is ‘ruler flat’ (i.e. as straight as the edge of a ruler), just like the theoretical ideal. Above 5kHz we see a gradual rise in the microphone’s output level, reaching a peak of +2.5dB around 15kHz before rolling off to about +1dB at 20kHz (it continues down to -6dB at 40kHz, making it a good choice for those who create sound effects by lowering the pitch of recorded sounds). The peak in the high frequency response ultimately represents an increase in the microphone’s Sensitivity at those frequencies, which means the microphone exaggerates those higher frequencies. Why? The 4006A is primarily intended for recording acoustic instruments at a distance, sometimes many metres away. As we move further away from the source the sound becomes duller due to air absorption (i.e. for any given distance, the air absorbs more high frequency energy than it absorbs low frequency energy). The 4006A’s high frequency boost is intended to compensate for the loss of high frequencies over distance. It’s a very popular microphone with sound engineers who need to record orchestras and pipe organs – two applications that require distant miking while maintaining high frequency detail.

Neumann’s KM183 (above) is a small single diaphragm omnidirectional condenser microphone designed for similar applications as DPA’s 4006A. It offers a flat response from 20Hz to 2kHz, then gently rises to about +8dB at 9kHz before rolling off to -1dB at 20kHz. It’s very similar to the on-axis response of DPA’s 4006A with the diffuse field grid added.
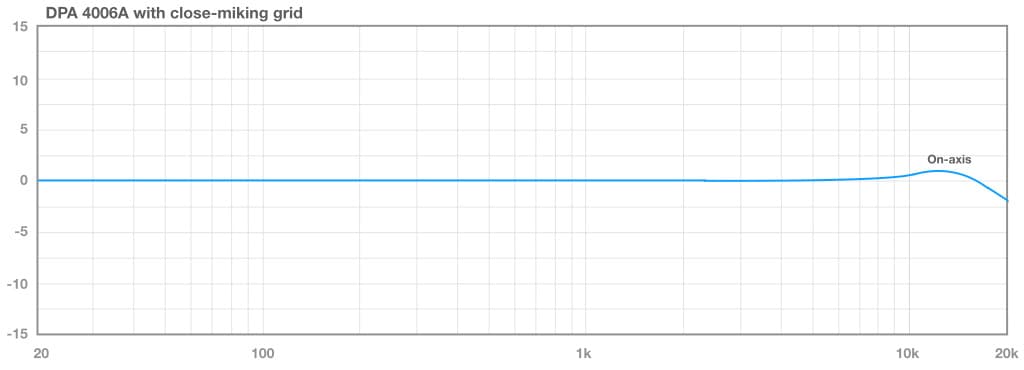
Due to their high frequency boosts, both of the above microphones might be considered too bright, too harsh or too detailed for close-miking applications. Fitting the close-miking diffraction grid to DPA’s 4006A helps considerably, as shown below. It extends the free field grid’s flat response from 5kHz up to 8kHz, rises to a gentle peak of a dB or two around 12kHz (air compensation), then rolls off to -5dB at 20kHz. This would probably be a preferable tonality than the free field grid or the diffuse field grid when close-miking, but there are many applications where it would still be considered too bright. For example, close-miking metallic and wooden percussion or finger-picked steel string guitar – all situations that create fast attack transients that are rich in high frequency detail. Much of this high frequency detail is absorbed in the air by the time it reaches a listener some metres away, but a microphone placed 30cm or so from the instrument is going to capture the full brunt of it. That’s not likely to be the sound we want to capture unless we’re making a sample library or similar.
BeyerDynamic’s M130 ribbon microphone offers the opposite characteristic at high frequencies. Its frequency response (shown below) is essentially flat from 400Hz to 6kHz, then we see the high frequency roll-off that’s inherent in the design of all ribbon microphones – in this case falling to -10dB at 20kHz. The M130 is not a popular choice for the distant miking applications that DPA’s 4006A and Neumann’s KM183 are suited for – it is too dull and its Sensitivity might be too low – but it’s very popular for close-miking wooden and metallic percussion and similar sounds with very fast attack transients, and also for capturing the sound of electric guitar amplifiers. Its high frequency roll-off provides a tonality that could be described as mellow, dull or dark, depending on your application. It has the benefit of taming bright attack transients in a similar way as the air does over distance, often making it a preferable choice for close-miking than the more ‘accurate’ small single diaphragm condensers.
The result is a sound that is often described as ‘natural’; it provides the detail, focus and minimised spill of close-miking, but with a high frequency roll-off that approximates the effect of the air between the instrument and the listener. It’s up close but doesn’t feel like it, hence ‘natural’…
It’s up close but doesn’t feel like it, hence ‘natural’…

We’ve just looked at how high frequency boosts and roll-offs can be used to our advantage, but what’s happening at the low frequencies? DPA’s 4006A and Neumann’s KM183 both have flat responses down to 20Hz or lower, but BeyerDynamic’s M130 has a low frequency roll-off that begins at 100Hz and falls to -7dB at 50Hz – which is where their response graph ends. Projecting further down the slope, we can expect the roll-off to reach -18dB at 20Hz. Why is this?
The 4006A and KM183 are single diaphragm omnidirectional microphones that belong to a family of microphones known as pressure transducers. One characteristic of pressure transducers is an extended low frequency response that remains consistent regardless of the distance from the sound source, because they do not have any proximity effect. It’s one of the reasons why small single diaphragm omnis are popular with engineers who need to capture sounds from a distance – such as recording orchestras, chamber music ensembles, and nature soundscapes.
The M130 is a bidirectional ribbon microphone, and belongs to a family of directional microphones known as pressure gradient transducers. A fundamental characteristic of pressure gradient transducers is that their low frequency response changes with distance – when close to the sound source (typically less than 30cm) the low frequencies are exaggerated due to the proximity effect, but when used at a distance (typically more than 30cm) there’s a low frequency roll-off that causes the captured sound to lack low frequency energy.
We’ll discuss pressure and pressure gradient transducers in a forthcoming instalment of this series. The important thing to understand for now is that most directional microphones use pressure gradient transducers, which means they are prone to the proximity effect. We must keep that in mind when considering their suitability for our intended application.
In the examples given above, DPA’s 4006A and Neumann’s KM183 are both omnidirectional pressure transducers and therefore have no proximity effect, so their low frequency response remains the same at any distance. Beyer’s M130 is a bidirectional pressure gradient transducer and therefore has proximity effect, so its low frequency response changes with distance. There is no measurement distance given in the M130’s specification sheet, so we don’t know what distance provides the low frequency response shown here.
TAILORING FOR SPECIFIC APPLICATIONS
Let’s look at some microphones that have their frequency responses tailored for specific applications. For the following examples we’ll be focusing on dynamic microphones. Why? As we saw in an earlier instalment of this series, a dynamic microphone’s frequency response consists almost entirely of carefully controlled resonances. This makes it difficult to create dynamic microphones with theoretically ideal flat responses from 20Hz to 20kHz, but it does make them ideal for creating microphones with frequency responses that are tailored for specific applications. By placing the resonances appropriately, we can put peaks and dips where we want them in the frequency response. If we factor in the microphone’s intended application and consider the proximity effect, we can make microphones that excel at doing very specific things.
Shure SM58
Shure’s SM58 provides a good example of a microphone with a frequency response that has been tailored for a specific application, as shown below. It’s a dynamic cardioid microphone designed for handheld vocal use, and fits the performance application profile described earlier.
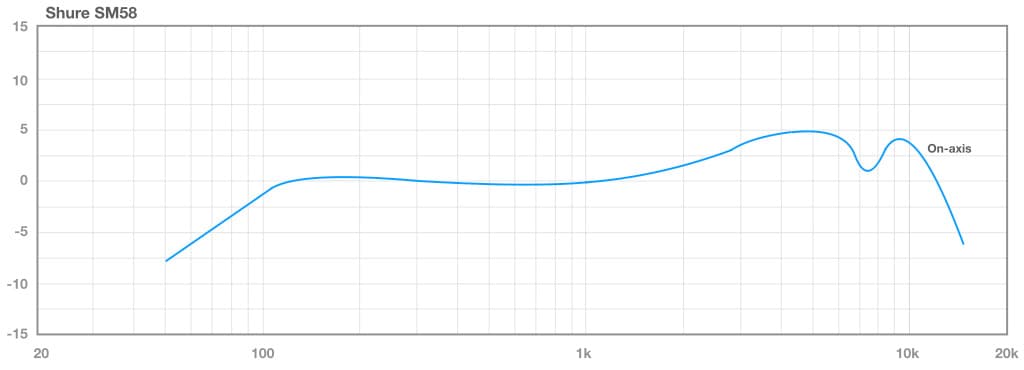
Below 400Hz its frequency response is quite similar to BeyerDynamic’s M130 ribbon mic shown earlier. We see a similar low-frequency roll-off from 100Hz down to 50Hz, with a subtle hump in the low frequencies from 100Hz up to 400Hz. On the SM58 this subtle hump is followed by an equally subtle dip between 400Hz and 1kHz. Neither of those is worth discussing at this point in time – some manufacturers might smooth them out altogether – but things get interesting above 1kHz. The response gradually rises, creating a large upper midrange hump that reaches +5dB at 5kHz. At first glance this seems intended to maximise vocal intelligibility, allowing the vocal to compete with heavily distorted electric guitars, crashing cymbals and so on – to ‘cut through the mix’ as live sound engineers are fond of saying – but there’s more to it than that, as we’ll see shortly. The response dips 4dB from +5dB down to +1dB at 7.5kHz, possibly to minimise essing, then climbs to about +4dB at 10kHz before rolling off to -6dB somewhere around 15kHz. The graph ends there, having covered the vocal range, but if we project further downwards we can expect to see it falling to -15dB at 20kHz. Without that high frequency roll-off (i.e. if the response remained at +4dB from 10kHz onwards) the microphone would be exaggerating spill from cymbals and similar sounds from the drum kit – which is usually placed behind the vocalist in a typical live band set-up on stage. This high frequency roll-off is essentially a low pass filter for frequencies above the vocal range.
The above interpretation is based on a casual glance at the SM58’s frequency response, which makes it look like a microphone with a relatively extreme upper midrange boost. However, that assumption ignores its intended use scenario, i.e. its application profile. When placed less than 30cm from the voice the proximity effect comes into play, boosting the low frequencies and bringing them back into perspective with the boosted upper midrange seen in the frequency response curve. Experienced vocalists learn how to ‘play’ the proximity effect, adding more or less low frequency energy to their voice to achieve the desired tonality. This clever balancing of the proximity effect with the upper midrange boost allows a close-miked voice to have a full and detailed sound without getting boomy or muddy. Meanwhile, low frequency spill from the drums and bass is too far away from the mic to benefit from the proximity effect’s boost and receives a reduced low frequency response instead, resulting in an effect that’s similar to applying a high pass filter to maintain vocal intelligibility.
When used up close and factoring in the proximity effect, the SM58 ends up with a frequency response that’s tailored for close-miking the human voice – along with a bandpass filter (the HF and LF roll-offs) to minimise the audibility of sounds beyond the vocal range. Regardless of whether these things are by fault or by design, it’s not hard to understand why the SM58 has remained a firm favourite ever since its introduction in 1966.
Shure Beta52A
Shure’s Beta52A provides another good example of a microphone tailored for a specific application. It’s a dynamic mic with a supercardioid polar response, specifically designed for use with kick drums and similar bass instruments. Let’s take a closer look at it…

Ever since the late 1970s it’s been common practice in popular music to add an upper midrange boost to the kick drum sound, typically around 4kHz, to bring out the impact of the beater hitting the skin and give the kick some definition. That peak has been built into the Beta52A. In fact, it’s the most striking feature of the frequency response shown above: a +7dB peak at 4kHz. Above that peak the response rolls-off rapidly, which, by fault or by design, minimises the audibility of spill from the snare bottom. A small hump in the roll-off at 8kHz, an octave above the 4kHz peak, helps to keep the overall peak a bit broader and more ‘musical’ – although it might simply be the effect of a resonator cap or similar added to extend the high frequency response (as discussed in the earlier instalment about dynamic microphones).
When close-miking a kick for popular music applications it’s also common (depending on the genre) to remove some low midrange energy around 300Hz to 400Hz to prevent the kick from sounding too boxy – and we can see that a subtle dip around that area has been built into the Beta52A’s response.
Between the upper midrange peak and low midrange dip, we can see that two of the most commonly used EQ points when mixing kick drums for popular music have been built into the Beta52A, helping it to deliver an acceptably fashionable sound straight out of the microphone.
If judged by the frequency response curve shown above you’d be forgiven for dismissing the Beta52A as being too bright and clicky, but, as with the SM58, that judgement does not factor in the proximity effect. The frequency response graph shown above was measured at a distance of 60cm from where the beater hits the skin, which places the mic somewhere outside the front skin where the sound is usually woolly and dull. This is typical of the kick mic placement for Modern Jazz and similar applications, where the kick needs to sound natural and there is often no hole in the front skin to pass through the high frequency transients caused by the impact of the beater. At this distance the prominent 4kHz boost adds some much-needed definition without sounding clicky.
The graph below shows how the proximity effect alters the Beta52A’s low frequency response at distances of 5cm (+5dB at 50Hz), 2.5cm (+8dB at 50Hz) and 0.3cm (+14dB at 50Hz) from where the beater hits the skin. We can see how the proximity effect increases the amount of low frequency energy coming out of the microphone, making that 4kHz peak a less significant part of the overall frequency response as the mic is moved closer. At these distances the impact of the beater on the skin is so strong that it doesn’t require any help from the mic’s upper midrange boost anyway.
…you’d be forgiven for dismissing the Beta52A as being too bright and clicky…
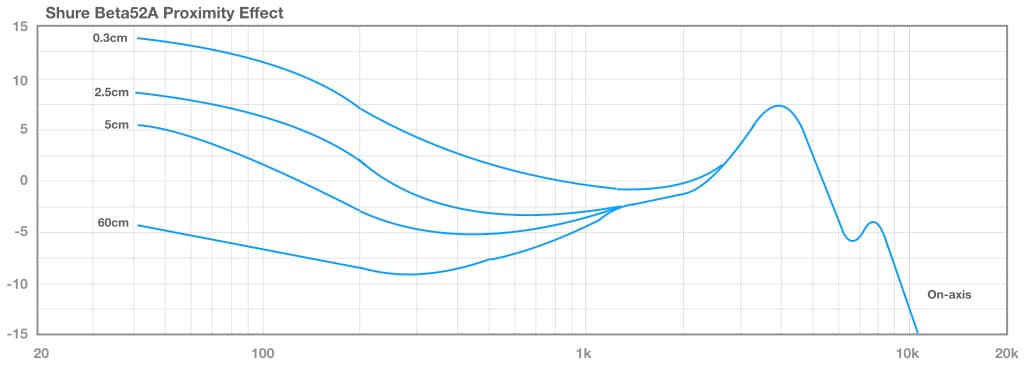
The Beta52A’s combination of proximity effect, low midrange dip and upper midrange peak creates a kick drum microphone that provides an acceptably fashionable sound across numerous genres, changing tonality in accordance with the miking distances typically used for those genres.
ElectroVoice RE20
Many directional microphones intended for close-miking have similar characteristics to the SM58 and Beta52A – an exaggerated upper midrange that is ultimately balanced out by the proximity effect when the sound source is close. When using these microphones for voice, brass, woodwind and other sound sources that are capable of moving closer and further from the mic, the musician is able to ‘play’ the proximity effect to create the desired tonality.
However, there are times when this is not a desirable quality – for example, radio announcers, podcasters and Youtubers. In these situations the announcer or presenter could be required to move around a little while talking, and is unable to maintain a consistent distance to the microphone. This results in unintentional variations in the tonality of their voice due to the proximity effect. They might also have one or two guest speakers who are not familiar with speaking into a microphone and won’t maintain a consistent distance, again unintentionally changing the tonality of their voices. Omnidirectional microphones don’t have any proximity effect and would not cause this problem (which is one of the reasons why handheld dynamic omnis are commonly used for ‘on the street’ interviews and news-related sound bytes), but are not a good choice when there are not supposed to be external noises such as traffic, air conditioning, untreated room acoustics and similar. For situations where directionality is needed without any significant proximity effect, ElectroVoice’s RE20 provides a good solution. It’s a dynamic cardioid that uses ElectroVoice’s ‘Variable-D’ technology (the D is for ‘distance’) to minimise the proximity effect, making it a popular choice with broadcasters and podcasters. Announcers can move closer or further from the RE20 without any significant changes in tonality at low frequencies.

The illustration above shows the frequency response of the RE20. Unlike Shure’s SM58 and others there is no significant boost in the upper midrange because there is no need to balance the upper midrange against the proximity effect’s low frequency boost when used up close.
The RE20’s frequency response curve is relatively even from 70Hz up to about 1.5kHz. Most microphones designed for voice tend to have peaks in the upper midrange (aka ‘presence peaks’), but, instead, the RE20 features subtle dips in the upper midrange — there’s one around 2kHz and another around 4kHz. These dips are followed by a rise of about 1dB between 5kHz and 10kHz (probably to aid intelligibility and provide a sense of air) before rolling off to -5dB at 20kHz.
The RE20 offers directionality without the proximity effect, making it an ideal choice for voice applications where it’s not possible to maintain a consistent distant between the voice and the microphone, and where there’s no desire to ‘play’ the proximity effect as part of the performance. Its directional polar response and lack of proximity effect also make it a popular choice with double bassists who need to be close-miked on stage while pivoting their instrument back and forth on its pin. Most double-bassists will show you exactly where to put it in front of their instrument, and they’ll do the rest of the work for you – moving in for quiet parts and using the bow, and pulling back for loud parts, all without any change in low frequency energy.
The RE20’s combination of a directional polar response, a relatively smooth frequency response with no significant proximity effect, and the ruggedness of a dynamic microphone, collectively make it a unique and valuable addition to any microphone collection.





Man, my knowledge is getting up there with all this great knowledge laid out so easily! Now that Al Schmitt’s use of mic technique makes even more sense.
I’m glad you’re enjoying them! More coming…